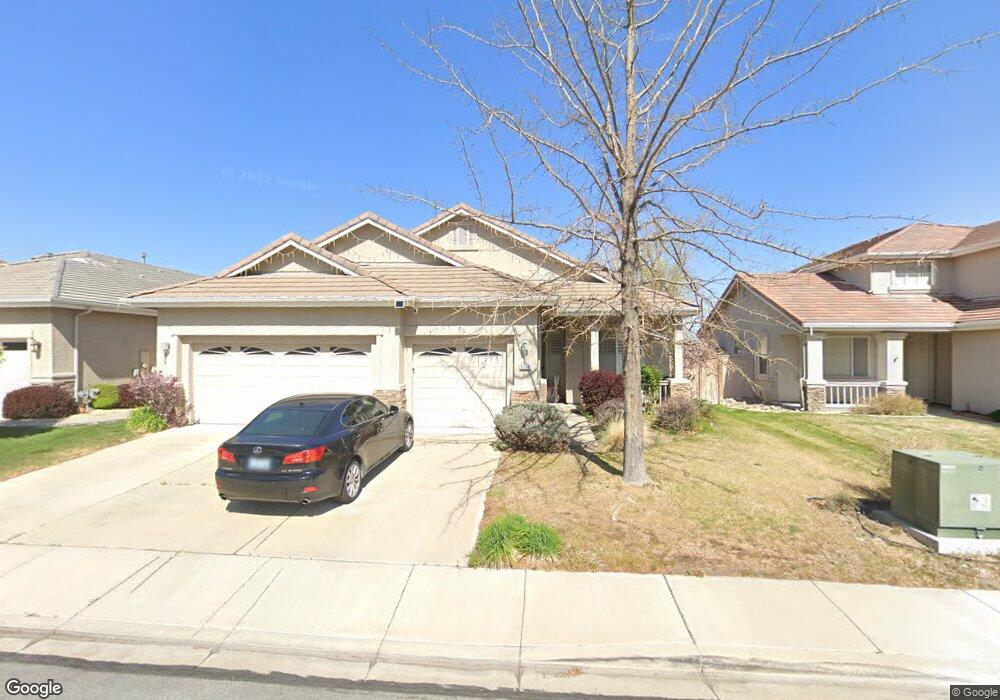
2285 Quailwood Dr Reno, NV 89521
Virginia Foothills NeighborhoodEstimated Value: $625,812 - $674,000
3
Beds
2
Baths
1,880
Sq Ft
$348/Sq Ft
Est. Value
About This Home
This home is located at 2285 Quailwood Dr, Reno, NV 89521 and is currently estimated at $653,953, approximately $347 per square foot. 2285 Quailwood Dr is a home located in Washoe County with nearby schools including Jwood Raw Elementary School, Kendyl Depoali Middle School, and Damonte Ranch High School.
Ownership History
Date
Name
Owned For
Owner Type
Purchase Details
Closed on
Aug 24, 2010
Sold by
Bersch Patricia and Bersch Stephen
Bought by
Bersch Stephen L and Bersch Patricia H
Current Estimated Value
Purchase Details
Closed on
Jul 28, 2010
Sold by
First Horizon Home Loans
Bought by
Bersch Stephen and Bersch Patricia
Purchase Details
Closed on
Jun 7, 2010
Sold by
Klimek William M
Bought by
First Horizon Home Loans
Purchase Details
Closed on
Jun 11, 2007
Sold by
Bailey and Bailey Dutton
Bought by
Klimek William M
Home Financials for this Owner
Home Financials are based on the most recent Mortgage that was taken out on this home.
Original Mortgage
$279,000
Interest Rate
6.62%
Mortgage Type
Unknown
Create a Home Valuation Report for This Property
The Home Valuation Report is an in-depth analysis detailing your home's value as well as a comparison with similar homes in the area
Home Values in the Area
Average Home Value in this Area
Purchase History
| Date | Buyer | Sale Price | Title Company |
|---|---|---|---|
| Bersch Stephen L | -- | None Available | |
| Bersch Stephen | $215,500 | Ticor Title Reno | |
| First Horizon Home Loans | $199,750 | None Available | |
| Klimek William M | $349,000 | Capital Title Company |
Source: Public Records
Mortgage History
| Date | Status | Borrower | Loan Amount |
|---|---|---|---|
| Previous Owner | Klimek William M | $279,000 |
Source: Public Records
Tax History Compared to Growth
Tax History
| Year | Tax Paid | Tax Assessment Tax Assessment Total Assessment is a certain percentage of the fair market value that is determined by local assessors to be the total taxable value of land and additions on the property. | Land | Improvement |
|---|---|---|---|---|
| 2025 | $4,014 | $129,004 | $40,635 | $88,369 |
| 2024 | $4,014 | $127,420 | $38,430 | $88,990 |
| 2023 | $3,719 | $122,543 | $38,430 | $84,113 |
| 2022 | $3,446 | $102,178 | $32,319 | $69,859 |
| 2021 | $3,192 | $97,787 | $28,350 | $69,437 |
| 2020 | $3,001 | $97,810 | $28,350 | $69,460 |
| 2019 | $2,858 | $92,331 | $26,114 | $66,217 |
| 2018 | $2,726 | $83,066 | $18,365 | $64,701 |
| 2017 | $2,618 | $82,798 | $18,081 | $64,717 |
| 2016 | $2,551 | $82,228 | $16,128 | $66,100 |
| 2015 | $2,547 | $80,771 | $15,089 | $65,682 |
| 2014 | $2,467 | $76,733 | $12,947 | $63,786 |
| 2013 | -- | $64,298 | $11,904 | $52,394 |
Source: Public Records
Map
Nearby Homes
- 10825 Farmstead Ln
- 10677 Foxberry Park Dr
- 40S Se4nw4-S16 18n 21e
- 40S Nw4sw4-S16 18n 21e
- 40S Sw4nw4-S16 18n 21e
- 40S Nw4nw4-S16 18n 21e
- 2348 Hammer Falls Dr
- 12518 Brass Ridge St
- 2277 White Clay Dr
- 2520 Country Falls Ln Unit 15B
- 0 Double Diamond Pkwy Unit 210005046
- 0 Double Diamond Pkwy Unit 210005044
- 2250 Copper Brand Dr
- 0 Geiger Grade Unit 250053963
- 0 Us Hwy 395 S Unit 240002170
- 10677 Fire Poppy Cir
- 0 Cinder Ln Unit 250001294
- 11020 Colton Dr
- 1876 Braemore Dr
- 2432 Kate's Bridge Dr Unit Glenwood 546
- 2285 Quailwood Dr
- 2275 Quailwood Dr
- 2295 Quailwood Dr Unit 19A1
- 2265 Quailwood Dr
- 2299 Quailwood Dr
- 2280 Quailwood Dr
- 2290 Quailwood Dr
- 2270 Quailwood Dr Unit 19A1
- 2255 Quailwood Dr
- 10735 Misty Meadows Dr
- 2245 Quailwood Dr Unit 19A1
- 10710 Clear Vista Dr
- 10724 Misty Meadows Dr
- 10718 Misty Meadows Dr
- 10718 Misty Meadows Dr Unit NV
- 10712 Misty Meadows Dr
- 10730 Misty Meadows Dr
- 10706 Misty Meadows Dr
- 10741 Misty Meadows Dr
- 2235 Quailwood Dr