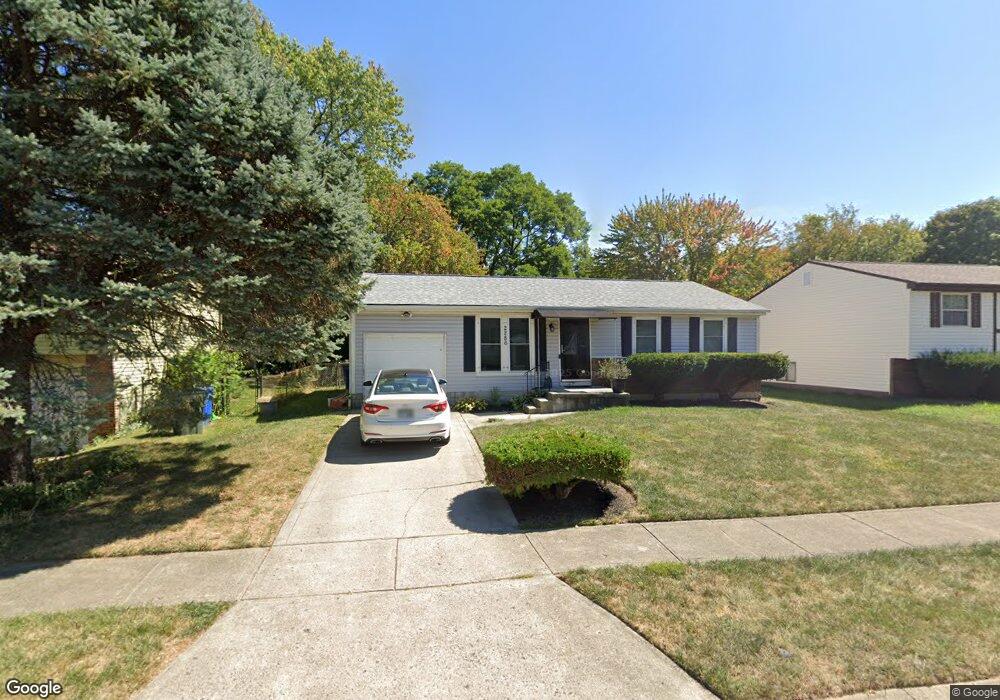
2286 Tempest Dr Columbus, OH 43232
Glenbrook NeighborhoodEstimated Value: $124,000 - $191,000
3
Beds
2
Baths
1,008
Sq Ft
$169/Sq Ft
Est. Value
About This Home
This home is located at 2286 Tempest Dr, Columbus, OH 43232 and is currently estimated at $170,321, approximately $168 per square foot. 2286 Tempest Dr is a home located in Franklin County with nearby schools including Easthaven Elementary School, Yorktown Middle School, and Independence High School.
Ownership History
Date
Name
Owned For
Owner Type
Purchase Details
Closed on
Nov 11, 2009
Sold by
Hall Elaine M and Hall Charles Kevin
Bought by
Hall Elaine M
Current Estimated Value
Home Financials for this Owner
Home Financials are based on the most recent Mortgage that was taken out on this home.
Original Mortgage
$81,848
Interest Rate
4.87%
Mortgage Type
FHA
Purchase Details
Closed on
Jun 25, 1999
Sold by
Lawson Dolores M
Bought by
Early Thrasher Elaine M
Home Financials for this Owner
Home Financials are based on the most recent Mortgage that was taken out on this home.
Original Mortgage
$86,955
Interest Rate
7.15%
Mortgage Type
FHA
Purchase Details
Closed on
Jul 5, 1983
Bought by
Lawson Dolores M
Create a Home Valuation Report for This Property
The Home Valuation Report is an in-depth analysis detailing your home's value as well as a comparison with similar homes in the area
Home Values in the Area
Average Home Value in this Area
Purchase History
| Date | Buyer | Sale Price | Title Company |
|---|---|---|---|
| Hall Elaine M | -- | None Available | |
| Early Thrasher Elaine M | $87,000 | Connor Title Co | |
| Lawson Dolores M | $41,300 | -- |
Source: Public Records
Mortgage History
| Date | Status | Borrower | Loan Amount |
|---|---|---|---|
| Closed | Hall Elaine M | $81,848 | |
| Closed | Early Thrasher Elaine M | $86,955 |
Source: Public Records
Tax History
| Year | Tax Paid | Tax Assessment Tax Assessment Total Assessment is a certain percentage of the fair market value that is determined by local assessors to be the total taxable value of land and additions on the property. | Land | Improvement |
|---|---|---|---|---|
| 2025 | $2,177 | $48,510 | $17,500 | $31,010 |
| 2024 | $2,177 | $48,510 | $17,500 | $31,010 |
| 2023 | $2,149 | $48,510 | $17,500 | $31,010 |
| 2022 | $1,547 | $29,820 | $7,630 | $22,190 |
| 2021 | $1,549 | $29,820 | $7,630 | $22,190 |
| 2020 | $1,551 | $29,820 | $7,630 | $22,190 |
| 2019 | $1,433 | $23,630 | $6,090 | $17,540 |
| 2018 | $1,316 | $23,630 | $6,090 | $17,540 |
| 2017 | $1,433 | $23,630 | $6,090 | $17,540 |
| 2016 | $1,324 | $19,990 | $4,870 | $15,120 |
| 2015 | $1,202 | $19,990 | $4,870 | $15,120 |
| 2014 | $1,192 | $19,780 | $5,110 | $14,670 |
| 2013 | $588 | $19,775 | $5,110 | $14,665 |
Source: Public Records
Map
Nearby Homes
- 2310 Tempest Dr
- 3745 Wynds Dr
- 2472 Nassau Dr Unit 37D
- 3830 Charbonnett Ct Unit 6-A
- 2275 Cardston Ct
- 3369 Petzinger Rd
- 2251 Meridian Ct
- 0 Eastpoint Dr
- 0 Groves Rd
- 4375 Refugee Rd
- 3777 E Deshler Ave
- 3466 Westpoint Dr
- 1792 Bostwick Rd
- 3135 Easthaven Dr S
- 0 Rotunda Dr Unit 271
- 2278 Wadsworth Dr Unit D
- 1884 Barnett Ct W
- 3355 E Deshler Ave
- 1619 Basil Dr
- 1656 Vilardo Ln
- 2294 Tempest Dr
- 2278 Tempest Dr
- 3776 Ides Ct
- 2270 Tempest Dr
- 2302 Tempest Dr
- 3784 Ides Ct Unit 3784
- 2285 Tempest Dr
- 2277 Tempest Dr
- 3775 Ides Ct
- 3775 Petzinger Rd
- 2293 Tempest Dr
- 3783 Petzinger Rd Unit 785
- 2262 Tempest Dr
- 3783-3785 Petzinger Rd
- 3791 Petzinger Rd
- 2301 Tempest Dr
- 2265 Tempest Dr
- 3799 Petzinger Rd Unit 801
- 3799 Petzinger Rd
- 2318 Tempest Dr
Your Personal Tour Guide
Ask me questions while you tour the home.