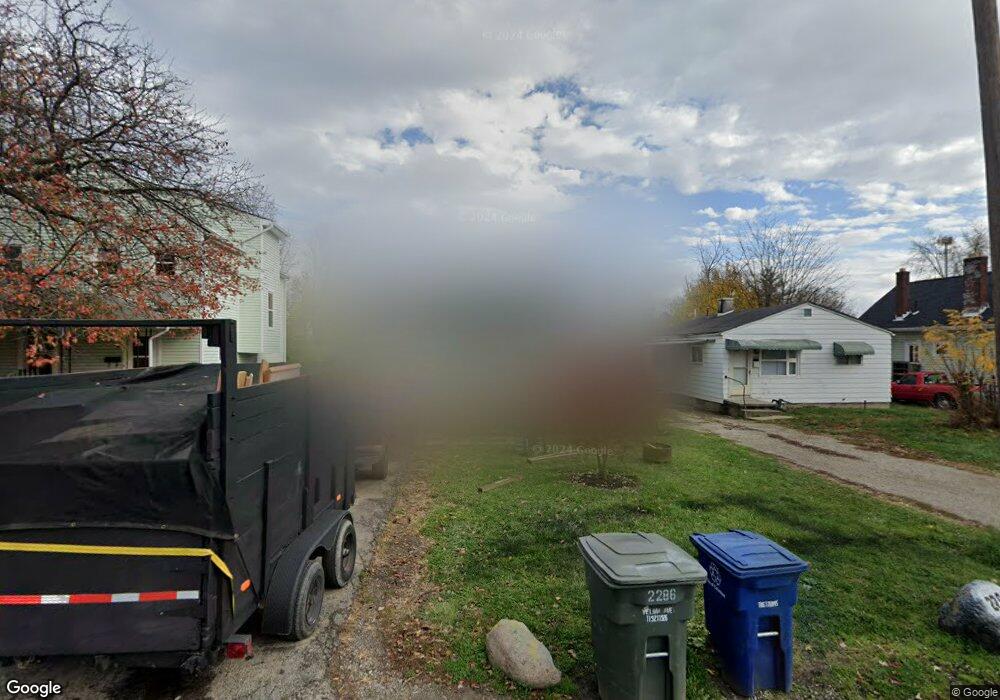
2286 Velma Ave Columbus, OH 43211
South Linden NeighborhoodEstimated Value: $86,000 - $116,495
2
Beds
1
Bath
672
Sq Ft
$144/Sq Ft
Est. Value
About This Home
This home is located at 2286 Velma Ave, Columbus, OH 43211 and is currently estimated at $96,624, approximately $143 per square foot. 2286 Velma Ave is a home located in Franklin County with nearby schools including Como Elementary School, Dominion Middle School, and Whetstone High School.
Ownership History
Date
Name
Owned For
Owner Type
Purchase Details
Closed on
Jun 20, 2025
Sold by
Hill Family Properties Llc
Bought by
Stepp Bobby
Current Estimated Value
Purchase Details
Closed on
Dec 9, 2008
Sold by
Cherevas Nellie
Bought by
Hill Myron
Purchase Details
Closed on
May 25, 2007
Sold by
Gearhart Spencer and Gerhart Kelly
Bought by
Hill Myron and Cherevas Nellie
Purchase Details
Closed on
Mar 9, 2005
Sold by
Scott Franklin C and Scott Rita
Bought by
Gearhart Spencer
Purchase Details
Closed on
Nov 9, 2004
Sold by
Vance Betty and Ripley Helen
Bought by
Scott Franklin C
Purchase Details
Closed on
Sep 15, 2004
Sold by
Estate Of Leona Scott
Bought by
Mullin Gwyn Scott
Purchase Details
Closed on
Sep 14, 2004
Sold by
Estate Of George R Scott
Bought by
Estate Of Leona Scott
Purchase Details
Closed on
Feb 5, 2003
Sold by
Estate Of Raymond Scott
Bought by
Scott Franklin C and Vance Betty
Purchase Details
Closed on
Jan 2, 2003
Sold by
Estate Of Leona Scott
Bought by
Bradley Tim
Purchase Details
Closed on
Jun 4, 1976
Bought by
Scott Raymond W
Create a Home Valuation Report for This Property
The Home Valuation Report is an in-depth analysis detailing your home's value as well as a comparison with similar homes in the area
Home Values in the Area
Average Home Value in this Area
Purchase History
| Date | Buyer | Sale Price | Title Company |
|---|---|---|---|
| Stepp Bobby | $90,000 | None Listed On Document | |
| Hill Myron | $15,000 | Attorney | |
| Hill Myron | $39,000 | Worthington | |
| Gearhart Spencer | $36,600 | -- | |
| Scott Franklin C | -- | -- | |
| Mullin Gwyn Scott | -- | -- | |
| Estate Of Leona Scott | -- | -- | |
| Scott Franklin C | -- | -- | |
| Scott Raymond W | -- | -- | |
| Bradley Tim | -- | -- | |
| Scott Leona | -- | -- | |
| Scott Franklin C | -- | -- | |
| Scott Raymond W | -- | -- | |
| Scott Raymond W | -- | -- |
Source: Public Records
Tax History Compared to Growth
Tax History
| Year | Tax Paid | Tax Assessment Tax Assessment Total Assessment is a certain percentage of the fair market value that is determined by local assessors to be the total taxable value of land and additions on the property. | Land | Improvement |
|---|---|---|---|---|
| 2024 | $1,200 | $26,180 | $5,530 | $20,650 |
| 2023 | $1,185 | $26,180 | $5,530 | $20,650 |
| 2022 | $1,276 | $13,240 | $2,700 | $10,540 |
| 2021 | $1,145 | $13,240 | $2,700 | $10,540 |
| 2020 | $877 | $13,240 | $2,700 | $10,540 |
| 2019 | $686 | $11,030 | $2,280 | $8,750 |
| 2018 | $651 | $11,030 | $2,280 | $8,750 |
| 2017 | $686 | $11,030 | $2,280 | $8,750 |
| 2016 | $673 | $9,170 | $2,240 | $6,930 |
| 2015 | $617 | $9,170 | $2,240 | $6,930 |
| 2014 | $569 | $9,170 | $2,240 | $6,930 |
| 2013 | $312 | $10,185 | $2,485 | $7,700 |
Source: Public Records
Map
Nearby Homes
- 2247 Atwood Terrace
- 2315 Hiawatha Park Dr
- 2352 Hiawatha Park Dr
- 2383 Hiawatha Park Dr Unit 2385
- 2389 Hiawatha Park Dr Unit 391
- 2390 Atwood Terrace
- 2214 Grasmere Ave
- 968 Duxberry Ave
- 2487 Azelda St
- 2495 Pontiac St
- 2173 Lexington Ave
- 2301 Jefferson Ave
- 2243-2245 Lexington Ave
- 2544 Azelda St
- 2166 Lexington Ave
- 1084 E Hudson St
- 2453 McGuffey Rd
- 2234 Hamilton Ave
- 2488 McGuffey Rd
- 497 E Oakland Ave
- 2290 Velma Ave Unit 292
- 2290 Velma Ave Unit 2292
- 2276 Velma St
- 2270 Velma Ave
- 2308 Velma Ave
- 2277 Hiawatha Park Dr Unit 279
- 2283 Hiawatha Park Dr
- 2273 Hiawatha Park Dr
- 2266 Velma Ave
- 2289 Hiawatha Park Dr
- 2267 Hiawatha Park Dr Unit 269
- 2267 Hiawatha Park Dr Unit 267 & 269
- 2267-2269 Hiawatha Park Dr
- 2287 Velma Ave
- 2283 Velma Ave
- 2295 Hiawatha Park Dr
- 2314 Velma Ave
- 2277 Velma Ave
- 2260 Velma Ave
- 2299 Hiawatha Park Dr