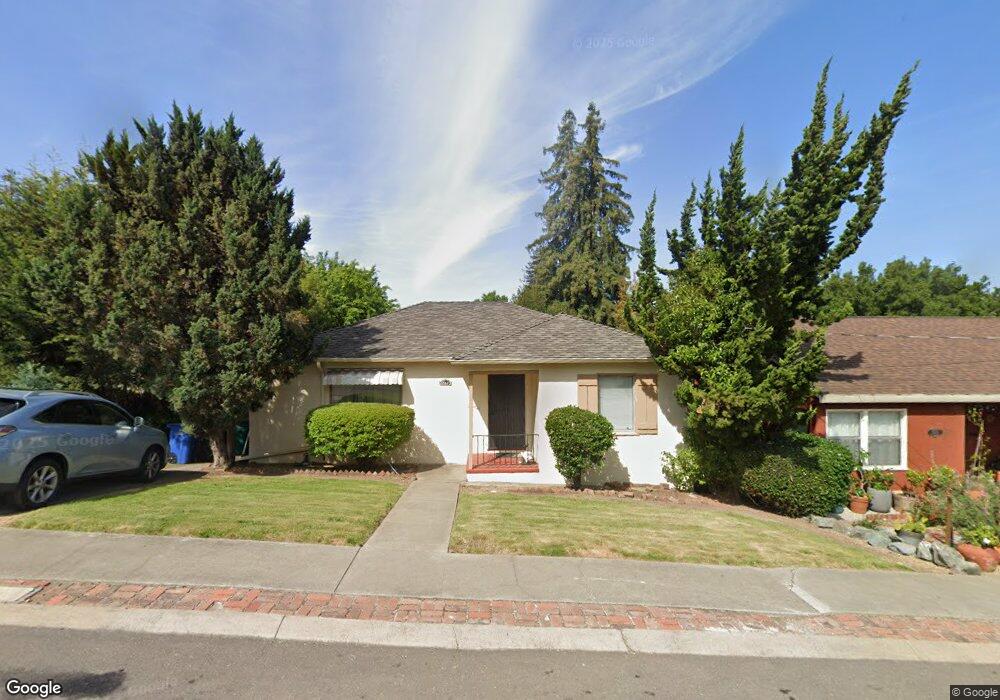
22873 Upland Way Hayward, CA 94541
Upper B Street NeighborhoodEstimated Value: $657,000 - $760,000
2
Beds
1
Bath
1,071
Sq Ft
$668/Sq Ft
Est. Value
About This Home
This home is located at 22873 Upland Way, Hayward, CA 94541 and is currently estimated at $714,959, approximately $667 per square foot. 22873 Upland Way is a home located in Alameda County with nearby schools including Fairview Elementary School, Bret Harte Middle School, and Hayward High School.
Ownership History
Date
Name
Owned For
Owner Type
Purchase Details
Closed on
Sep 14, 2019
Sold by
Holland Allysia D
Bought by
Ad Holland Living Trust and Holland
Current Estimated Value
Purchase Details
Closed on
Jun 4, 2012
Sold by
Colbert Mary K
Bought by
Holland Allysia D
Home Financials for this Owner
Home Financials are based on the most recent Mortgage that was taken out on this home.
Original Mortgage
$207,100
Interest Rate
3.79%
Mortgage Type
New Conventional
Purchase Details
Closed on
Dec 17, 2004
Sold by
Gorgoletis Tommy
Bought by
Colbert Mary K
Home Financials for this Owner
Home Financials are based on the most recent Mortgage that was taken out on this home.
Original Mortgage
$289,000
Interest Rate
4.02%
Mortgage Type
Purchase Money Mortgage
Create a Home Valuation Report for This Property
The Home Valuation Report is an in-depth analysis detailing your home's value as well as a comparison with similar homes in the area
Home Values in the Area
Average Home Value in this Area
Purchase History
| Date | Buyer | Sale Price | Title Company |
|---|---|---|---|
| Ad Holland Living Trust | -- | None Listed On Document | |
| Holland Allysia D | $218,000 | Chicago Title Company | |
| Colbert Mary K | $463,000 | Fidelity National Title Co |
Source: Public Records
Mortgage History
| Date | Status | Borrower | Loan Amount |
|---|---|---|---|
| Previous Owner | Holland Allysia D | $207,100 | |
| Previous Owner | Colbert Mary K | $289,000 |
Source: Public Records
Tax History Compared to Growth
Tax History
| Year | Tax Paid | Tax Assessment Tax Assessment Total Assessment is a certain percentage of the fair market value that is determined by local assessors to be the total taxable value of land and additions on the property. | Land | Improvement |
|---|---|---|---|---|
| 2025 | $4,179 | $266,805 | $82,141 | $191,664 |
| 2024 | $4,179 | $261,438 | $80,531 | $187,907 |
| 2023 | $4,121 | $263,175 | $78,952 | $184,223 |
| 2022 | $4,005 | $251,015 | $77,404 | $180,611 |
| 2021 | $4,253 | $245,957 | $75,887 | $177,070 |
| 2020 | $4,212 | $250,365 | $75,109 | $175,256 |
| 2019 | $4,172 | $245,458 | $73,637 | $171,821 |
| 2018 | $3,849 | $240,647 | $72,194 | $168,453 |
| 2017 | $3,053 | $235,930 | $70,779 | $165,151 |
| 2016 | $2,866 | $231,304 | $69,391 | $161,913 |
| 2015 | $2,811 | $227,831 | $68,349 | $159,482 |
| 2014 | $2,677 | $223,368 | $67,010 | $156,358 |
Source: Public Records
Map
Nearby Homes
- 2209 Romey Ln
- 2272 Kelly St
- 2207 Dexter Ct
- 23022 Palazzo Del Kayla
- 2214 D St
- 23661 Glenbrook Ln
- 22537 Center St Unit 207
- 23730 Stratton Ct
- 23066 Maud Ave
- 22490 Bayview Ave
- 2936 Pickford Way
- 23920 Mayville Dr
- 2468 Hidden Ln
- 22095 Betlen Way
- 2980 D St
- 1775 Panda Way Unit 337
- 23049 Lakeridge Ave
- 23380 Lakeridge Ave
- 3241 Monika Ln
- 22003 Hoffman Way
- 22865 Upland Way
- 22889 Upland Way
- 2270 Romey Ln
- 22857 Upland Way
- 22792 Moura Ct
- 2260 Romey Ln
- 22849 Upland Way
- 22786 Moura Ct
- 22874 Upland Way
- 2250 Romey Ln
- 22866 Upland Way
- 22898 Upland Way
- 2295 Romey Ln
- 22858 Upland Way
- 22841 Upland Way
- 22890 Upland Way
- 2240 Romey Ln
- 22780 Moura Ct
- 22850 Upland Way
- 22833 Upland Way