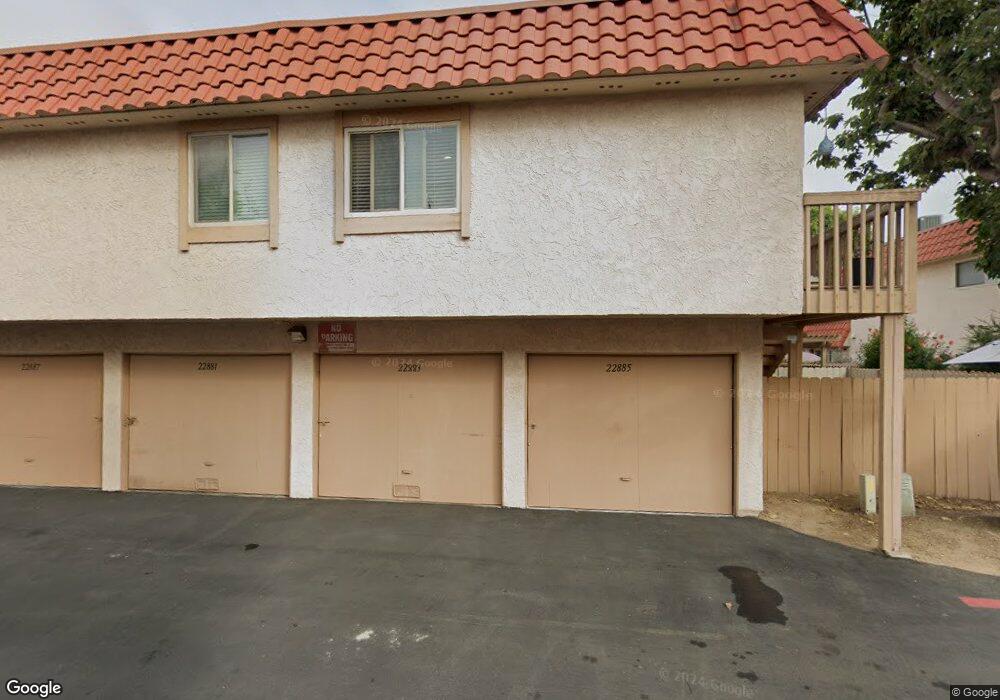
22885 Bonita Ln Unit 3 Lake Forest, CA 92630
Estimated Value: $520,817 - $643,000
2
Beds
2
Baths
1,022
Sq Ft
$557/Sq Ft
Est. Value
About This Home
This home is located at 22885 Bonita Ln Unit 3, Lake Forest, CA 92630 and is currently estimated at $569,204, approximately $556 per square foot. 22885 Bonita Ln Unit 3 is a home located in Orange County with nearby schools including Santiago STEAM Magnet Elementary School, Serrano Intermediate School, and El Toro High School.
Ownership History
Date
Name
Owned For
Owner Type
Purchase Details
Closed on
Feb 24, 2000
Sold by
Mealey Patricia J
Bought by
Gonzales Tina M
Current Estimated Value
Home Financials for this Owner
Home Financials are based on the most recent Mortgage that was taken out on this home.
Original Mortgage
$127,300
Outstanding Balance
$43,423
Interest Rate
8.38%
Mortgage Type
FHA
Estimated Equity
$525,781
Purchase Details
Closed on
Apr 12, 1996
Sold by
Ba Properties Inc
Bought by
Mealey Patricia J
Home Financials for this Owner
Home Financials are based on the most recent Mortgage that was taken out on this home.
Original Mortgage
$66,500
Interest Rate
7.84%
Mortgage Type
FHA
Purchase Details
Closed on
Feb 1, 1996
Sold by
Lisenby Howard R
Bought by
Ba Properties Inc
Create a Home Valuation Report for This Property
The Home Valuation Report is an in-depth analysis detailing your home's value as well as a comparison with similar homes in the area
Home Values in the Area
Average Home Value in this Area
Purchase History
| Date | Buyer | Sale Price | Title Company |
|---|---|---|---|
| Gonzales Tina M | $134,000 | United Title Company | |
| Mealey Patricia J | $76,500 | American Title Ins Co | |
| Ba Properties Inc | $114,663 | North American Title Co |
Source: Public Records
Mortgage History
| Date | Status | Borrower | Loan Amount |
|---|---|---|---|
| Open | Gonzales Tina M | $127,300 | |
| Previous Owner | Mealey Patricia J | $66,500 |
Source: Public Records
Tax History Compared to Growth
Tax History
| Year | Tax Paid | Tax Assessment Tax Assessment Total Assessment is a certain percentage of the fair market value that is determined by local assessors to be the total taxable value of land and additions on the property. | Land | Improvement |
|---|---|---|---|---|
| 2025 | $2,055 | $205,944 | $127,160 | $78,784 |
| 2024 | $2,055 | $201,906 | $124,666 | $77,240 |
| 2023 | $2,005 | $197,948 | $122,222 | $75,726 |
| 2022 | $1,968 | $194,067 | $119,825 | $74,242 |
| 2021 | $1,928 | $190,262 | $117,475 | $72,787 |
| 2020 | $1,910 | $188,312 | $116,271 | $72,041 |
| 2019 | $1,870 | $184,620 | $113,991 | $70,629 |
| 2018 | $1,834 | $181,000 | $111,755 | $69,245 |
| 2017 | $1,796 | $177,451 | $109,563 | $67,888 |
| 2016 | $1,765 | $173,972 | $107,415 | $66,557 |
| 2015 | $1,743 | $171,359 | $105,801 | $65,558 |
| 2014 | $1,704 | $168,003 | $103,729 | $64,274 |
Source: Public Records
Map
Nearby Homes
- 22862 Bonita Ln
- 25312 Pizarro Rd
- 22718 Via Castilla
- 22962 Springwater
- 25331 Via Viejo
- 22941 Belquest Dr
- 24841 Calle el Toro Grande
- 22461 Silver Spur
- 24811 Calle el Toro Grande
- 23214 Orange Ave Unit 7
- 23216 Orange Ave Unit 6
- 22556 Charwood Cir
- 23220 Orange Ave Unit 2
- 23220 Orange Ave Unit 9
- 25482 Coral Wood St
- 23230 Orange Ave Unit 2
- 23294 Orange Ave Unit 1
- 25496 Coral Wood St
- 23292 Orange Ave Unit 6
- 23240 Orange Ave Unit 2
- 22887 Bonita Ln Unit 4
- 22883 Bonita Ln Unit 2
- 22881 Bonita Ln Unit 1
- 22875 Bonita Ln Unit 3
- 22875 Bonita Ln Unit 14
- 22877 Bonita Ln Unit 4
- 22888 Bonita Ln
- 22873 Bonita Ln Unit 2
- 22901 Bonita Ln Unit 1
- 22901 Bonita Ln
- 22871 Bonita Ln
- 22886 Bonita Ln
- 22903 Bonita Ln Unit 22
- 22903 Bonita Ln Unit 2
- 22898 Bonita Ln
- 22878 Bonita Ln Unit 4
- 22884 Bonita Ln Unit 2
- 22884 Bonita Ln
- 22896 Bonita Ln
- 22876 Bonita Ln