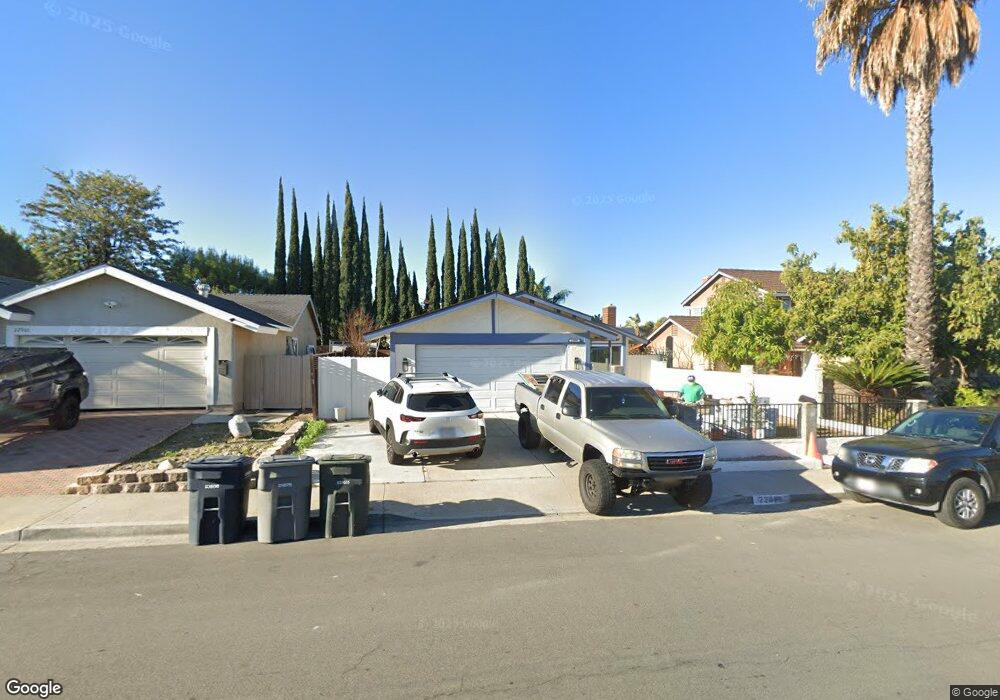
22895 Aspan St Lake Forest, CA 92630
Estimated Value: $787,000 - $1,056,000
3
Beds
2
Baths
1,224
Sq Ft
$791/Sq Ft
Est. Value
About This Home
This home is located at 22895 Aspan St, Lake Forest, CA 92630 and is currently estimated at $968,635, approximately $791 per square foot. 22895 Aspan St is a home located in Orange County with nearby schools including Olivewood Elementary School, Serrano Intermediate School, and El Toro High School.
Ownership History
Date
Name
Owned For
Owner Type
Purchase Details
Closed on
Mar 1, 2010
Sold by
Stuart Dianne M
Bought by
Taylor Marcia A and Olson Scott J
Current Estimated Value
Home Financials for this Owner
Home Financials are based on the most recent Mortgage that was taken out on this home.
Original Mortgage
$348,570
Outstanding Balance
$236,946
Interest Rate
5.5%
Mortgage Type
FHA
Estimated Equity
$731,689
Purchase Details
Closed on
May 26, 2006
Sold by
Stuart Dianne M and Gainor Dianne M
Bought by
Stuart Dianne M
Home Financials for this Owner
Home Financials are based on the most recent Mortgage that was taken out on this home.
Original Mortgage
$100,000
Interest Rate
6.55%
Mortgage Type
New Conventional
Purchase Details
Closed on
Aug 26, 2004
Sold by
Gainor Andrew J
Bought by
Gainor Dianne M
Home Financials for this Owner
Home Financials are based on the most recent Mortgage that was taken out on this home.
Original Mortgage
$408,750
Interest Rate
5%
Mortgage Type
New Conventional
Create a Home Valuation Report for This Property
The Home Valuation Report is an in-depth analysis detailing your home's value as well as a comparison with similar homes in the area
Home Values in the Area
Average Home Value in this Area
Purchase History
| Date | Buyer | Sale Price | Title Company |
|---|---|---|---|
| Taylor Marcia A | $355,000 | Chicago Title Company | |
| Stuart Dianne M | -- | Lsi Title Company | |
| Gainor Dianne M | -- | First American Title Co |
Source: Public Records
Mortgage History
| Date | Status | Borrower | Loan Amount |
|---|---|---|---|
| Open | Taylor Marcia A | $348,570 | |
| Previous Owner | Stuart Dianne M | $100,000 | |
| Previous Owner | Gainor Dianne M | $408,750 |
Source: Public Records
Tax History Compared to Growth
Tax History
| Year | Tax Paid | Tax Assessment Tax Assessment Total Assessment is a certain percentage of the fair market value that is determined by local assessors to be the total taxable value of land and additions on the property. | Land | Improvement |
|---|---|---|---|---|
| 2025 | $4,741 | $458,233 | $368,225 | $90,008 |
| 2024 | $4,741 | $449,249 | $361,005 | $88,244 |
| 2023 | $4,629 | $440,441 | $353,927 | $86,514 |
| 2022 | $4,547 | $431,805 | $346,987 | $84,818 |
| 2021 | $4,456 | $423,339 | $340,184 | $83,155 |
| 2020 | $4,417 | $418,999 | $336,696 | $82,303 |
| 2019 | $4,329 | $410,784 | $330,094 | $80,690 |
| 2018 | $4,248 | $402,730 | $323,622 | $79,108 |
| 2017 | $4,163 | $394,834 | $317,277 | $77,557 |
| 2016 | $4,094 | $387,093 | $311,056 | $76,037 |
| 2015 | $4,045 | $381,279 | $306,384 | $74,895 |
| 2014 | $3,957 | $373,811 | $300,383 | $73,428 |
Source: Public Records
Map
Nearby Homes
- 23981 Crescent Rd
- 22682 S Canada Ct
- 22627 Lakeside Ln
- 23976 Carmel Dr
- 22661 Pine Lake Ln
- 23211 Meadowbrook Cir
- 22576 Lake Forest Ln
- 22482 Lake Forest Ln
- 22875 Ridge Route Ln
- 24001 Muirlands Blvd Unit 411
- 24001 Muirlands Blvd Unit 56
- 24001 Muirlands Blvd Unit 221
- 24001 Muirlands Blvd Unit 185
- 24001 Muirlands Blvd Unit 329
- 24001 Muirlands Blvd Unit 347
- 24001 Muirlands Blvd Unit 115
- 24001 Muirlands Blvd Unit 34
- 24001 Muirlands Blvd Unit 119
- 24001 Muirlands Blvd Unit 268
- 24001 Muirlands Blvd Unit 147
- 22891 Aspan St
- 22901 Aspan St
- 22922 Mullin Rd
- 22911 Aspan St
- 22881 Aspan St
- 22912 Mullin Rd
- 22932 Mullin Rd
- 22902 Mullin Rd
- 22921 Aspan St
- 22896 Aspan St
- 22892 Aspan St
- 22882 Aspan St
- 23871 Gates St
- 22931 Aspan St
- 23912 Oswego St
- 22872 Aspan St
- 23861 Gates St
- 22876 Gretta St
- 23891 Gates St
- 22868 Aspan St