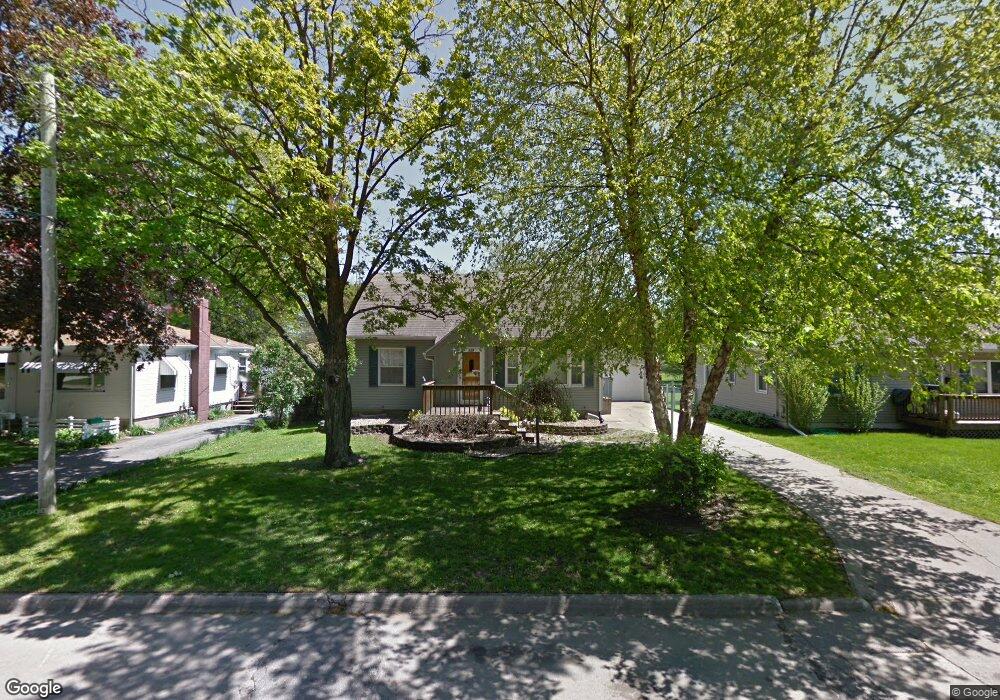
229 20th St NW Cedar Rapids, IA 52405
Estimated Value: $181,000 - $198,000
3
Beds
2
Baths
1,398
Sq Ft
$135/Sq Ft
Est. Value
About This Home
This home is located at 229 20th St NW, Cedar Rapids, IA 52405 and is currently estimated at $188,663, approximately $134 per square foot. 229 20th St NW is a home located in Linn County with nearby schools including Junction City Elementary School, Cleveland Elementary School, and Kentucky Tech - Ashland Reg Tech Center.
Ownership History
Date
Name
Owned For
Owner Type
Purchase Details
Closed on
Jan 4, 2008
Sold by
Federal National Mortgage Association
Bought by
Morrison Kevin D and Morrison Avis M
Current Estimated Value
Home Financials for this Owner
Home Financials are based on the most recent Mortgage that was taken out on this home.
Original Mortgage
$86,850
Outstanding Balance
$54,363
Interest Rate
6%
Mortgage Type
Unknown
Estimated Equity
$134,300
Purchase Details
Closed on
Sep 9, 2004
Sold by
Svoboda Lenae L
Bought by
Lefler Paul A and Lefler Patricia L
Home Financials for this Owner
Home Financials are based on the most recent Mortgage that was taken out on this home.
Original Mortgage
$111,625
Interest Rate
6.17%
Mortgage Type
New Conventional
Purchase Details
Closed on
Sep 6, 2000
Sold by
Crowley Joseph S and Crowley Tami M
Bought by
Svoboda Lenae L
Home Financials for this Owner
Home Financials are based on the most recent Mortgage that was taken out on this home.
Original Mortgage
$88,270
Interest Rate
7.99%
Create a Home Valuation Report for This Property
The Home Valuation Report is an in-depth analysis detailing your home's value as well as a comparison with similar homes in the area
Home Values in the Area
Average Home Value in this Area
Purchase History
| Date | Buyer | Sale Price | Title Company |
|---|---|---|---|
| Morrison Kevin D | -- | None Available | |
| Lefler Paul A | $117,000 | -- | |
| Svoboda Lenae L | $90,500 | -- |
Source: Public Records
Mortgage History
| Date | Status | Borrower | Loan Amount |
|---|---|---|---|
| Open | Morrison Kevin D | $86,850 | |
| Previous Owner | Lefler Paul A | $111,625 | |
| Previous Owner | Svoboda Lenae L | $88,270 |
Source: Public Records
Tax History Compared to Growth
Tax History
| Year | Tax Paid | Tax Assessment Tax Assessment Total Assessment is a certain percentage of the fair market value that is determined by local assessors to be the total taxable value of land and additions on the property. | Land | Improvement |
|---|---|---|---|---|
| 2025 | $2,884 | $180,200 | $35,500 | $144,700 |
| 2024 | $2,996 | $171,600 | $32,400 | $139,200 |
| 2023 | $2,996 | $163,000 | $32,400 | $130,600 |
| 2022 | $2,936 | $142,000 | $27,800 | $114,200 |
| 2021 | $2,834 | $141,700 | $27,800 | $113,900 |
| 2020 | $2,834 | $128,400 | $24,700 | $103,700 |
| 2019 | $2,630 | $122,000 | $24,700 | $97,300 |
| 2018 | $2,558 | $122,000 | $24,700 | $97,300 |
| 2017 | $2,568 | $117,900 | $24,700 | $93,200 |
| 2016 | $2,514 | $118,300 | $24,700 | $93,600 |
| 2015 | $2,548 | $119,748 | $24,720 | $95,028 |
| 2014 | $2,548 | $119,748 | $24,720 | $95,028 |
| 2013 | $2,494 | $119,748 | $24,720 | $95,028 |
Source: Public Records
Map
Nearby Homes
- 1649 B Ave NW
- 312 24th Ave NW
- 1832 8th Ave SW
- 159 26th St NW
- 1860 E Ave NW
- 451 23rd St NW
- 290 Highland Dr NW
- 1602 1st Ave NW
- 263 Highland Dr NW
- 2433 8th Ave SW
- 235 Highland Dr NW
- 232 27th St NW
- 1807 9th Ave SW
- 2437 9th Ave SW
- 425 28th St NW
- 615 27th St NW
- 623 27th St NW
- 1311 Burch Ave NW
- 1400 7th Ave SW
- 1814 Shawnee Ct NW
- 223 20th St NW
- 235 20th St NW
- 215 20th St NW
- 241 20th St NW
- 211 20th St NW
- 226 20th St NW
- 220 20th St NW
- 245 20th St NW
- 232 20th St NW
- 214 20th St NW
- 238 20th St NW
- 1926 Burch Ave NW
- 201 20th St NW
- 208 20th St NW
- 244 20th St NW
- 1920 Burch Ave NW
- 1943 Johnson Ave NW
- 228 19th St NW
- 1935 Johnson Ave NW
- 234 19th St NW