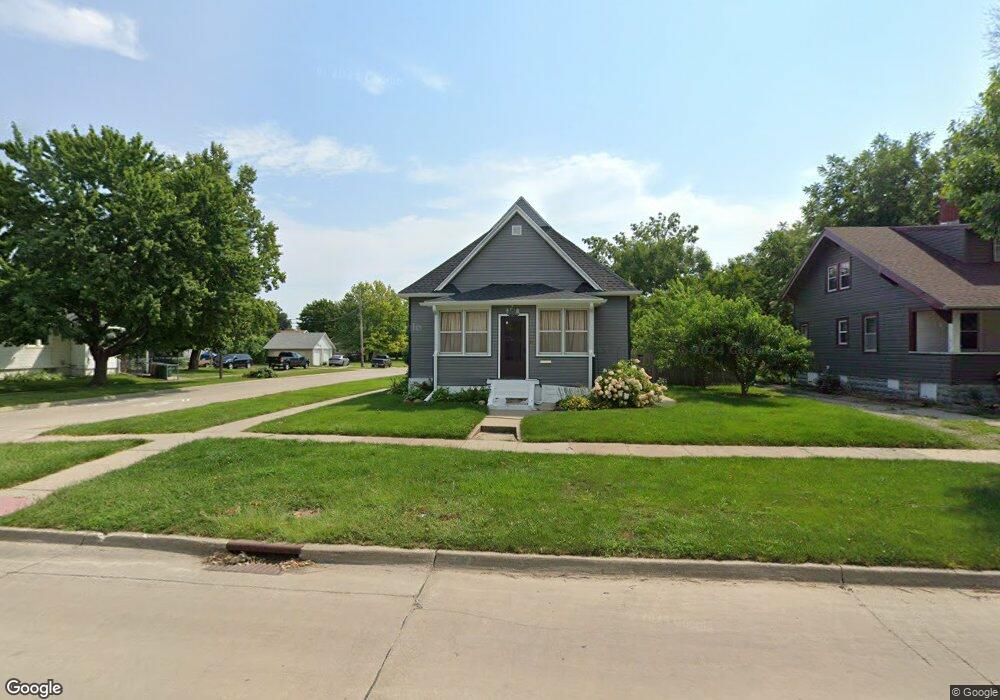
229 9th St West Des Moines, IA 50265
Estimated Value: $191,000 - $204,415
2
Beds
1
Bath
872
Sq Ft
$227/Sq Ft
Est. Value
About This Home
This home is located at 229 9th St, West Des Moines, IA 50265 and is currently estimated at $197,854, approximately $226 per square foot. 229 9th St is a home located in Polk County with nearby schools including Hillside Elementary School, Stilwell Junior High School, and Valley Southwoods Freshman High School.
Ownership History
Date
Name
Owned For
Owner Type
Purchase Details
Closed on
Sep 7, 1999
Sold by
Smith Elaine D and Smith Richard K
Bought by
Ramirez Juvencio P
Current Estimated Value
Home Financials for this Owner
Home Financials are based on the most recent Mortgage that was taken out on this home.
Original Mortgage
$71,138
Outstanding Balance
$20,634
Interest Rate
7.77%
Mortgage Type
FHA
Estimated Equity
$177,220
Purchase Details
Closed on
Sep 26, 1998
Sold by
Bright Mildred Bernice Clark
Bought by
Bright Mildred Bernice Clark and Smith Elaine D
Create a Home Valuation Report for This Property
The Home Valuation Report is an in-depth analysis detailing your home's value as well as a comparison with similar homes in the area
Home Values in the Area
Average Home Value in this Area
Purchase History
| Date | Buyer | Sale Price | Title Company |
|---|---|---|---|
| Ramirez Juvencio P | $71,500 | -- | |
| Bright Mildred Bernice Clark | -- | -- |
Source: Public Records
Mortgage History
| Date | Status | Borrower | Loan Amount |
|---|---|---|---|
| Open | Ramirez Juvencio P | $71,138 |
Source: Public Records
Tax History Compared to Growth
Tax History
| Year | Tax Paid | Tax Assessment Tax Assessment Total Assessment is a certain percentage of the fair market value that is determined by local assessors to be the total taxable value of land and additions on the property. | Land | Improvement |
|---|---|---|---|---|
| 2025 | $2,312 | $168,000 | $46,600 | $121,400 |
| 2024 | $2,312 | $156,300 | $43,200 | $113,100 |
| 2023 | $2,128 | $156,300 | $43,200 | $113,100 |
| 2022 | $2,102 | $119,100 | $34,700 | $84,400 |
| 2021 | $1,976 | $119,100 | $34,700 | $84,400 |
| 2020 | $1,942 | $107,100 | $31,300 | $75,800 |
| 2019 | $1,778 | $107,100 | $31,300 | $75,800 |
| 2018 | $1,778 | $95,300 | $27,700 | $67,600 |
| 2017 | $1,998 | $95,300 | $27,700 | $67,600 |
| 2016 | $1,950 | $103,000 | $25,900 | $77,100 |
| 2015 | $1,950 | $103,000 | $25,900 | $77,100 |
| 2014 | $1,822 | $98,800 | $23,100 | $75,700 |
Source: Public Records
Map
Nearby Homes