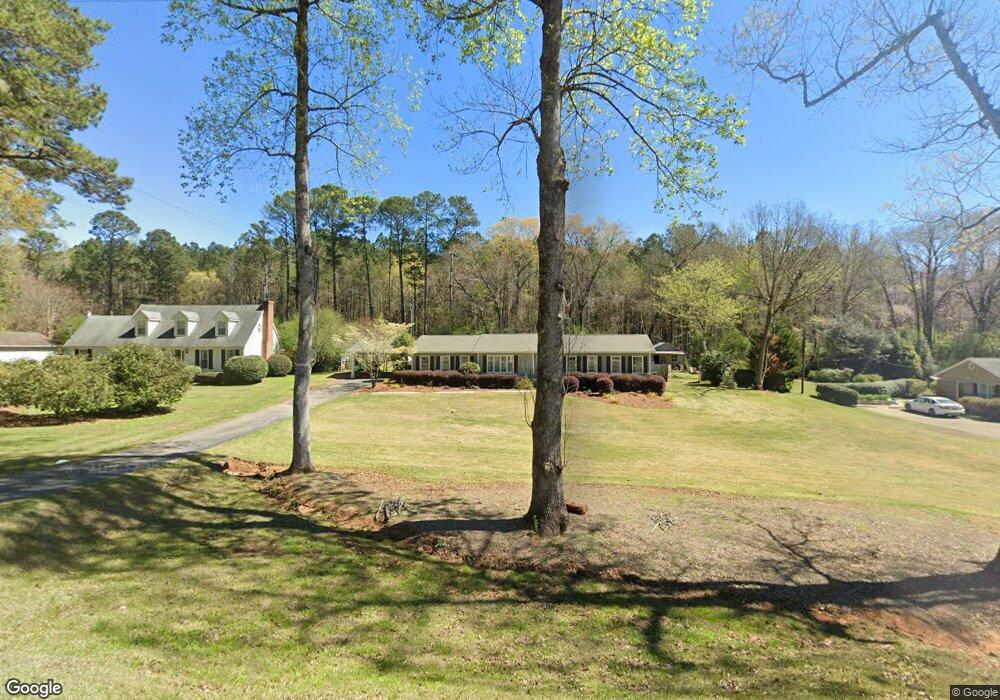
229 Baywood Cir Lagrange, GA 30240
Estimated Value: $385,442 - $553,000
4
Beds
3
Baths
2,968
Sq Ft
$158/Sq Ft
Est. Value
About This Home
This home is located at 229 Baywood Cir, Lagrange, GA 30240 and is currently estimated at $467,611, approximately $157 per square foot. 229 Baywood Cir is a home located in Troup County with nearby schools including Hollis Hand Elementary School, Ethel W. Kight Elementary School, and Franklin Forest Elementary School.
Ownership History
Date
Name
Owned For
Owner Type
Purchase Details
Closed on
Jun 10, 2005
Sold by
Easterwood David H
Bought by
Crocker Thomas E and Crocker Evyn Y
Current Estimated Value
Home Financials for this Owner
Home Financials are based on the most recent Mortgage that was taken out on this home.
Original Mortgage
$115,000
Outstanding Balance
$59,805
Interest Rate
5.7%
Mortgage Type
New Conventional
Estimated Equity
$407,806
Purchase Details
Closed on
Jul 31, 2002
Sold by
Lorne W Chambers
Bought by
Easterwood David H and Easterwood Lynn B
Purchase Details
Closed on
Mar 28, 1994
Sold by
Crowe Jerry
Bought by
Lorne W Chambers
Purchase Details
Closed on
Jul 25, 1986
Sold by
Julie H Kane
Bought by
Crowe Jerry
Purchase Details
Closed on
Jul 2, 1979
Sold by
Mayer W Smith
Bought by
Julie H Kane
Purchase Details
Closed on
Dec 15, 1975
Sold by
Edgar L Williamson
Bought by
Mayer W Smith
Purchase Details
Closed on
Jul 1, 1975
Bought by
Edgar L Williamson
Purchase Details
Closed on
Jan 13, 1975
Create a Home Valuation Report for This Property
The Home Valuation Report is an in-depth analysis detailing your home's value as well as a comparison with similar homes in the area
Home Values in the Area
Average Home Value in this Area
Purchase History
| Date | Buyer | Sale Price | Title Company |
|---|---|---|---|
| Crocker Thomas E | $185,500 | -- | |
| Easterwood David H | $117,500 | -- | |
| Lorne W Chambers | $79,000 | -- | |
| Crowe Jerry | $92,500 | -- | |
| Julie H Kane | -- | -- | |
| Mayer W Smith | -- | -- | |
| Edgar L Williamson | -- | -- | |
| -- | -- | -- |
Source: Public Records
Mortgage History
| Date | Status | Borrower | Loan Amount |
|---|---|---|---|
| Open | Crocker Thomas E | $115,000 |
Source: Public Records
Tax History Compared to Growth
Tax History
| Year | Tax Paid | Tax Assessment Tax Assessment Total Assessment is a certain percentage of the fair market value that is determined by local assessors to be the total taxable value of land and additions on the property. | Land | Improvement |
|---|---|---|---|---|
| 2024 | $3,466 | $129,080 | $18,000 | $111,080 |
| 2023 | $3,533 | $131,520 | $18,000 | $113,520 |
| 2022 | $3,357 | $122,280 | $18,000 | $104,280 |
| 2021 | $2,460 | $83,560 | $14,000 | $69,560 |
| 2020 | $2,460 | $83,560 | $14,000 | $69,560 |
| 2019 | $2,558 | $86,800 | $14,000 | $72,800 |
| 2018 | $2,454 | $83,360 | $12,000 | $71,360 |
| 2017 | $2,454 | $83,360 | $12,000 | $71,360 |
| 2016 | $2,455 | $83,392 | $12,000 | $71,392 |
| 2015 | $2,460 | $83,392 | $12,000 | $71,392 |
| 2014 | $2,449 | $82,900 | $12,000 | $70,900 |
| 2013 | -- | $82,408 | $12,000 | $70,408 |
Source: Public Records
Map
Nearby Homes
- 102 Willowcrest Way
- 654 Cameron Mill Rd
- 114 Morgan Dr
- 116 Morgan Dr
- 114-116 Morgan Dr
- 114 Millridge Dr
- 101 Deal Dr
- 641 Whitaker Rd
- 0 Cameron Mill Rd Unit 10640133
- 116 Deal Dr
- 208 Highland Trail
- 108 Spring Valley Dr
- 104 Spring Valley Dr
- 223 Pinehaven Dr
- 117 Brookwood Dr
- 200 Cheyenne Dr
- 106 Highland Park
- 146 Whitaker Rd
- E Angela Dr
- 0 Unit 10514554
- 227 Baywood Cir
- 231 Baywood Cir
- 110 Holly Ln
- 223 Baywood Cir
- 228 Baywood Cir
- 228 Baywood Cir Unit 33
- 233 Baywood Cir
- 233 Baywood Cir Unit 20
- 224 Baywood Cir
- 221 Baywood Cir
- 232 Baywood Cir
- 104 Holly Ln
- 222 Baywood Cir
- 105 Holly Ln
- 219 Baywood Cir
- 234 Baywood Cir
- 235 Baywood Cir
- 100 Holly Ln
- 103 Holly Ln
- 103 Holly Ln