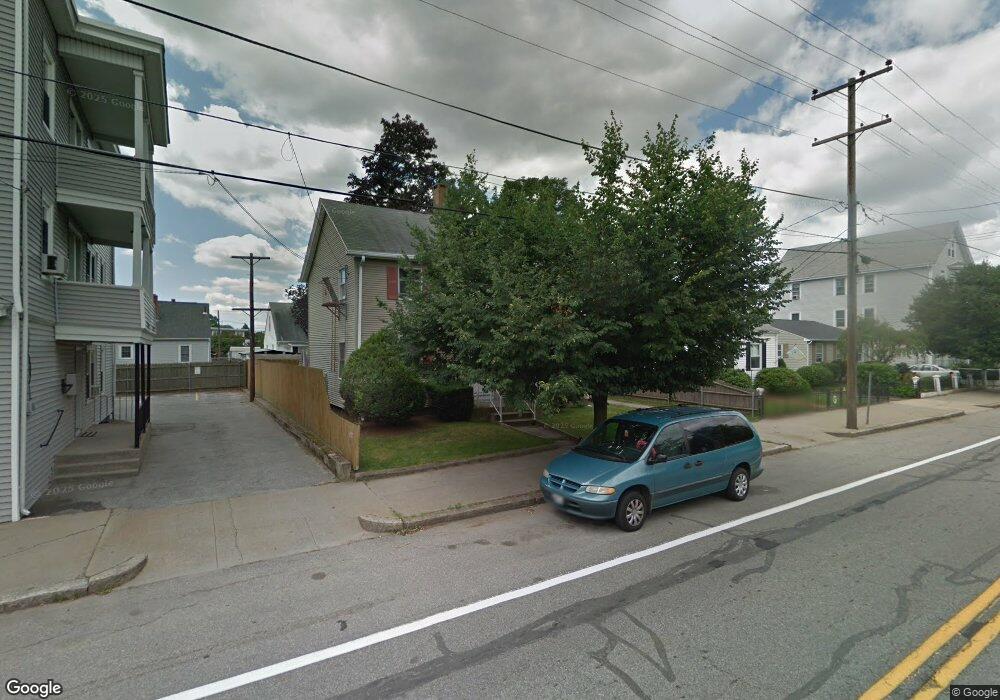
229 Benefit St Pawtucket, RI 02861
Darlington NeighborhoodEstimated Value: $389,433 - $509,000
3
Beds
2
Baths
1,320
Sq Ft
$351/Sq Ft
Est. Value
About This Home
This home is located at 229 Benefit St, Pawtucket, RI 02861 and is currently estimated at $463,108, approximately $350 per square foot. 229 Benefit St is a home located in Providence County with nearby schools including St Cecilia School and Dayspring Christian Academy.
Ownership History
Date
Name
Owned For
Owner Type
Purchase Details
Closed on
Aug 28, 2024
Sold by
Bedard Normand H
Bought by
Normand H Bedard T H and Normand Bedard
Current Estimated Value
Purchase Details
Closed on
Nov 1, 2000
Sold by
Bastow Earl and Bastow Joan
Bought by
Bedard Normand H
Home Financials for this Owner
Home Financials are based on the most recent Mortgage that was taken out on this home.
Original Mortgage
$85,500
Interest Rate
7.83%
Create a Home Valuation Report for This Property
The Home Valuation Report is an in-depth analysis detailing your home's value as well as a comparison with similar homes in the area
Home Values in the Area
Average Home Value in this Area
Purchase History
| Date | Buyer | Sale Price | Title Company |
|---|---|---|---|
| Normand H Bedard T H | -- | None Available | |
| Normand H Bedard T H | -- | None Available | |
| Bedard Normand H | $90,000 | -- | |
| Bedard Normand H | $90,000 | -- |
Source: Public Records
Mortgage History
| Date | Status | Borrower | Loan Amount |
|---|---|---|---|
| Previous Owner | Bedard Normand H | $85,500 |
Source: Public Records
Tax History
| Year | Tax Paid | Tax Assessment Tax Assessment Total Assessment is a certain percentage of the fair market value that is determined by local assessors to be the total taxable value of land and additions on the property. | Land | Improvement |
|---|---|---|---|---|
| 2025 | $4,148 | $315,400 | $111,000 | $204,400 |
| 2024 | $3,892 | $315,400 | $111,000 | $204,400 |
| 2023 | $3,939 | $232,500 | $85,500 | $147,000 |
| 2022 | $3,855 | $232,500 | $85,500 | $147,000 |
| 2021 | $3,855 | $232,500 | $85,500 | $147,000 |
| 2020 | $3,332 | $159,500 | $59,200 | $100,300 |
| 2019 | $3,332 | $159,500 | $59,200 | $100,300 |
| 2018 | $3,211 | $159,500 | $59,200 | $100,300 |
| 2017 | $2,840 | $125,000 | $44,800 | $80,200 |
| 2016 | $2,736 | $125,000 | $44,800 | $80,200 |
| 2015 | $2,736 | $125,000 | $44,800 | $80,200 |
| 2014 | $2,737 | $118,700 | $44,800 | $73,900 |
Source: Public Records
Map
Nearby Homes
- 207 Benefit St
- 40 Linton St
- 215 Kenyon Ave
- 179 Columbine Ave
- 39 Chaplin St
- 0 Chaplin St
- 83 Chaplin St
- 25 Burke St
- 37 Turner St
- 574 Central Ave
- 79 Turner St
- 61 Mendon Rd
- 9 Makin St
- 39 John St
- 80 Oakland Ave
- 548 Kenyon Ave Unit 25
- 548 Kenyon Ave Unit 4
- 140 Robinson Ave
- 50 Pullman Ave Unit A
- 50 Pullman Ave Unit B
Your Personal Tour Guide
Ask me questions while you tour the home.