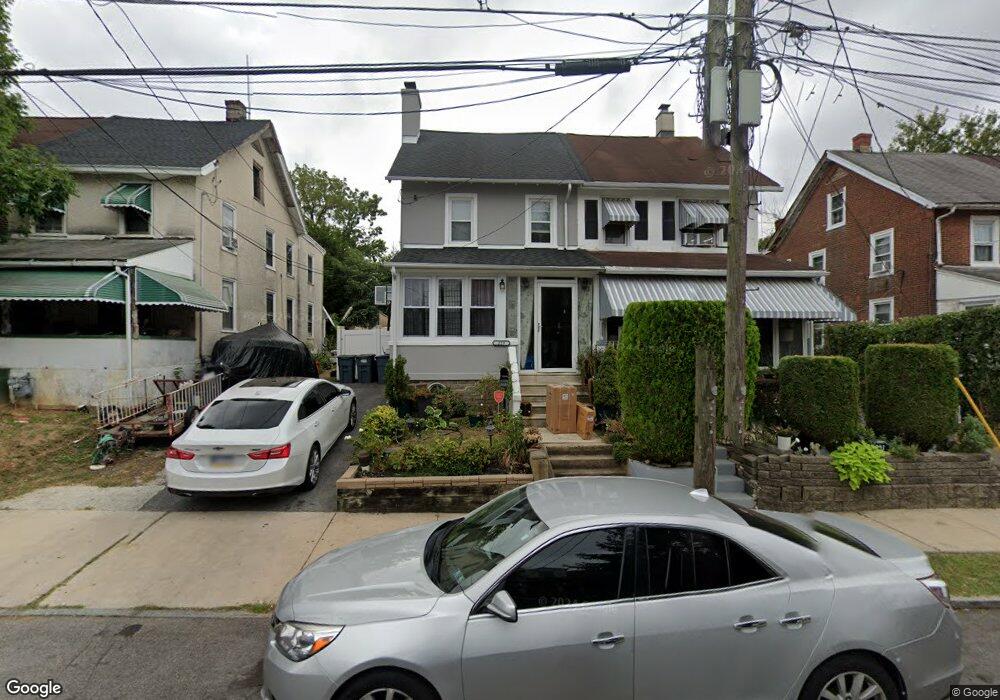
229 Chestnut Ave Ardmore, PA 19003
Estimated Value: $432,634 - $464,000
4
Beds
2
Baths
1,633
Sq Ft
$275/Sq Ft
Est. Value
About This Home
This home is located at 229 Chestnut Ave, Ardmore, PA 19003 and is currently estimated at $448,659, approximately $274 per square foot. 229 Chestnut Ave is a home located in Montgomery County with nearby schools including Penn Valley School, Welsh Valley Middle School, and Lower Merion High School.
Ownership History
Date
Name
Owned For
Owner Type
Purchase Details
Closed on
Nov 8, 2024
Sold by
Bowen Thalia M and Hartley Thalia M
Bought by
Hartley Thalia M
Current Estimated Value
Home Financials for this Owner
Home Financials are based on the most recent Mortgage that was taken out on this home.
Original Mortgage
$289,100
Outstanding Balance
$286,043
Interest Rate
6.32%
Mortgage Type
New Conventional
Estimated Equity
$162,616
Purchase Details
Closed on
Mar 6, 2003
Sold by
Deutsche Bk Nat Tr Co Tr
Bought by
Bowen Thalia M
Purchase Details
Closed on
Sep 25, 1997
Sold by
Va
Bought by
Bankers Trust Company Of California Na and Vendee Mtg Trust 1997-3
Purchase Details
Closed on
Nov 15, 1996
Sold by
Lalley Francis P
Bought by
Va
Create a Home Valuation Report for This Property
The Home Valuation Report is an in-depth analysis detailing your home's value as well as a comparison with similar homes in the area
Home Values in the Area
Average Home Value in this Area
Purchase History
| Date | Buyer | Sale Price | Title Company |
|---|---|---|---|
| Hartley Thalia M | -- | Lighthouse Settlement Services | |
| Hartley Thalia M | -- | Lighthouse Settlement Services | |
| Bowen Thalia M | $79,700 | -- | |
| Bankers Trust Company Of California Na | $80,000 | -- | |
| Va | $3,201 | -- |
Source: Public Records
Mortgage History
| Date | Status | Borrower | Loan Amount |
|---|---|---|---|
| Open | Hartley Thalia M | $289,100 | |
| Closed | Hartley Thalia M | $289,100 |
Source: Public Records
Tax History Compared to Growth
Tax History
| Year | Tax Paid | Tax Assessment Tax Assessment Total Assessment is a certain percentage of the fair market value that is determined by local assessors to be the total taxable value of land and additions on the property. | Land | Improvement |
|---|---|---|---|---|
| 2025 | $4,028 | $96,430 | $22,880 | $73,550 |
| 2024 | $4,028 | $96,430 | $22,880 | $73,550 |
| 2023 | $3,860 | $96,430 | $22,880 | $73,550 |
| 2022 | $3,788 | $96,430 | $22,880 | $73,550 |
| 2021 | $3,702 | $96,430 | $22,880 | $73,550 |
| 2020 | $3,611 | $96,430 | $22,880 | $73,550 |
| 2019 | $3,547 | $96,430 | $22,880 | $73,550 |
| 2018 | $3,548 | $96,430 | $22,880 | $73,550 |
| 2017 | $3,417 | $96,430 | $22,880 | $73,550 |
| 2016 | $3,380 | $96,430 | $22,880 | $73,550 |
| 2015 | $3,268 | $96,430 | $22,880 | $73,550 |
| 2014 | $3,151 | $96,430 | $22,880 | $73,550 |
Source: Public Records
Map
Nearby Homes
- 64 E Spring Ave
- 222 Lippincott Ave
- 140 Walnut Ave
- 2814 Saint Marys Rd
- 761 Hathaway Ln
- 818 Clifford Ave
- 754 Oak View Rd
- 221 Ardmore Ave
- 2939 Berkley Rd
- 101 Grandview Rd
- 1525 W Wynnewood Rd
- 236 W Spring Ave
- 14 Simpson Rd
- 2409 Belmont Ave
- 2321 Bryn Mawr Ave
- 2528 Rosemont Ave
- 442 E Spring Ave
- 1968 W Montgomery Ave
- 2222 Bryn Mawr Ave
- 103 W Montgomery Ave Unit 1A
- 231 Chestnut Ave
- 227 Chestnut Ave
- 225 Chestnut Ave
- 233 Chestnut Ave
- 223 Chestnut Ave
- 235 Chestnut Ave
- 221 Chestnut Ave
- 237 Chestnut Ave
- 219 Chestnut Ave
- 220 Sheas Terrace
- 218 Sheas Terrace
- 217 Chestnut Ave
- 224 Chestnut Ave
- 241 Chestnut Ave
- 226 Chestnut Ave
- 222 Chestnut Ave
- 216 Sheas Terrace
- 228 Chestnut Ave
- 220 Chestnut Ave
- 215 Chestnut Ave