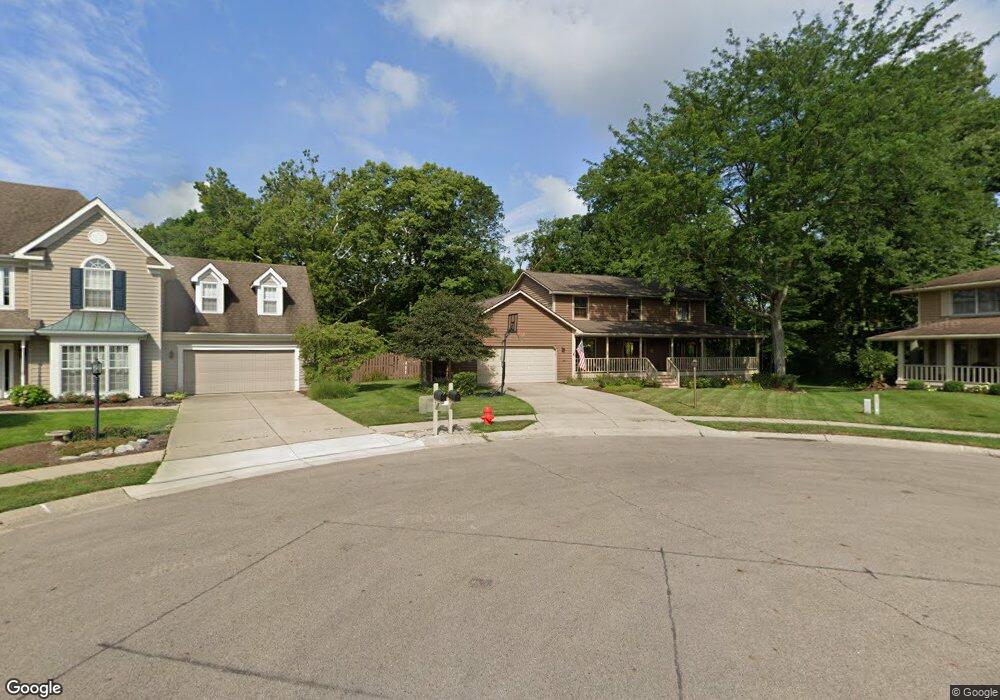
229 Deer Trail Dr Springboro, OH 45066
Estimated Value: $453,101 - $508,000
4
Beds
3
Baths
2,592
Sq Ft
$187/Sq Ft
Est. Value
About This Home
This home is located at 229 Deer Trail Dr, Springboro, OH 45066 and is currently estimated at $484,525, approximately $186 per square foot. 229 Deer Trail Dr is a home located in Warren County with nearby schools including Clearcreek Elementary School, Springboro Intermediate School, and Dennis Elementary School.
Ownership History
Date
Name
Owned For
Owner Type
Purchase Details
Closed on
May 7, 2020
Sold by
Kennedy Neal E and Kennedy Christine L
Bought by
Kennedy Neal E and Kennedy Christine L
Current Estimated Value
Purchase Details
Closed on
May 26, 2006
Sold by
Staab Joseph J
Bought by
Kennedy Neal E and Kennedy Christine L
Home Financials for this Owner
Home Financials are based on the most recent Mortgage that was taken out on this home.
Original Mortgage
$203,650
Outstanding Balance
$120,064
Interest Rate
6.62%
Mortgage Type
Purchase Money Mortgage
Estimated Equity
$364,461
Purchase Details
Closed on
Dec 4, 1997
Sold by
Meinhardt William P
Bought by
Staab Joseph J
Home Financials for this Owner
Home Financials are based on the most recent Mortgage that was taken out on this home.
Original Mortgage
$181,600
Interest Rate
7%
Mortgage Type
New Conventional
Purchase Details
Closed on
Aug 27, 1991
Sold by
Hickey Building Company
Bought by
P. Meinhardt and P. Wm.
Purchase Details
Closed on
Apr 18, 1991
Sold by
Tri-Ohio Development Co
Bought by
Hickey Building Company
Purchase Details
Closed on
Oct 20, 1989
Bought by
Tri-Ohio Development Co.
Create a Home Valuation Report for This Property
The Home Valuation Report is an in-depth analysis detailing your home's value as well as a comparison with similar homes in the area
Home Values in the Area
Average Home Value in this Area
Purchase History
| Date | Buyer | Sale Price | Title Company |
|---|---|---|---|
| Kennedy Neal E | -- | None Available | |
| Kennedy Neal E | $254,600 | Ohio Real Estate Title Inc | |
| Staab Joseph J | $227,000 | -- | |
| P. Meinhardt | $212,200 | -- | |
| Hickey Building Company | $37,000 | -- | |
| Tri-Ohio Development Co. | -- | -- |
Source: Public Records
Mortgage History
| Date | Status | Borrower | Loan Amount |
|---|---|---|---|
| Open | Kennedy Neal E | $203,650 | |
| Closed | Staab Joseph J | $181,600 |
Source: Public Records
Tax History Compared to Growth
Tax History
| Year | Tax Paid | Tax Assessment Tax Assessment Total Assessment is a certain percentage of the fair market value that is determined by local assessors to be the total taxable value of land and additions on the property. | Land | Improvement |
|---|---|---|---|---|
| 2024 | $5,095 | $130,420 | $31,500 | $98,920 |
| 2023 | $4,418 | $103,701 | $16,940 | $86,761 |
| 2022 | $4,353 | $103,702 | $16,940 | $86,762 |
| 2021 | $4,051 | $103,702 | $16,940 | $86,762 |
| 2020 | $3,830 | $85,705 | $14,000 | $71,705 |
| 2019 | $3,531 | $85,705 | $14,000 | $71,705 |
| 2018 | $3,534 | $85,705 | $14,000 | $71,705 |
| 2017 | $3,453 | $75,436 | $12,523 | $62,913 |
| 2016 | $3,601 | $75,436 | $12,523 | $62,913 |
| 2015 | $3,561 | $75,436 | $12,523 | $62,913 |
| 2014 | $3,561 | $70,500 | $11,700 | $58,800 |
| 2013 | $3,558 | $84,330 | $14,000 | $70,330 |
Source: Public Records
Map
Nearby Homes
- 510 Royal Springs Dr
- 450 Evergreen Dr
- 375 Tamarack Trail
- 180 Teakwood Ln
- 145 Cedar Hill Ln
- 23 Pheasant Run Cir Unit 9A
- 420 Clearcreek Franklin Rd
- 120 Clearview Dr
- 20 Terradyne Trace
- 150 Tanglewood Dr
- 15 Belvoir Ct
- 510 Thomas Dr
- 1785 Archerfield Place
- 65 Milford Ct
- 473 Mccray Blvd
- 12 Abbey Dr Unit 12
- 200 Sycamore Creek Dr
- 10987 Ayer Place
- 8531 Eagle Ridge
- 145 Redbud Dr
- 225 Deer Trail Dr
- 228 Deer Trail Dr
- 224 Deer Trail Dr
- 221 Deer Trail Dr
- 220 Deer Trail Dr
- 217 Deer Trail Dr
- 216 Deer Trail Dr
- 460 Queensgate Rd
- 213 Deer Trail Dr
- 450 Queensgate Rd
- 212 Deer Trail Dr
- 470 Queensgate Rd
- 440 Queensgate Rd
- 209 Deer Trail Dr
- 208 Deer Trail Dr
- 445 Queensgate Rd
- 480 Queensgate Rd
- 205 Deer Trail Dr
- 446 Saint James Place
- 455 Queensgate Rd