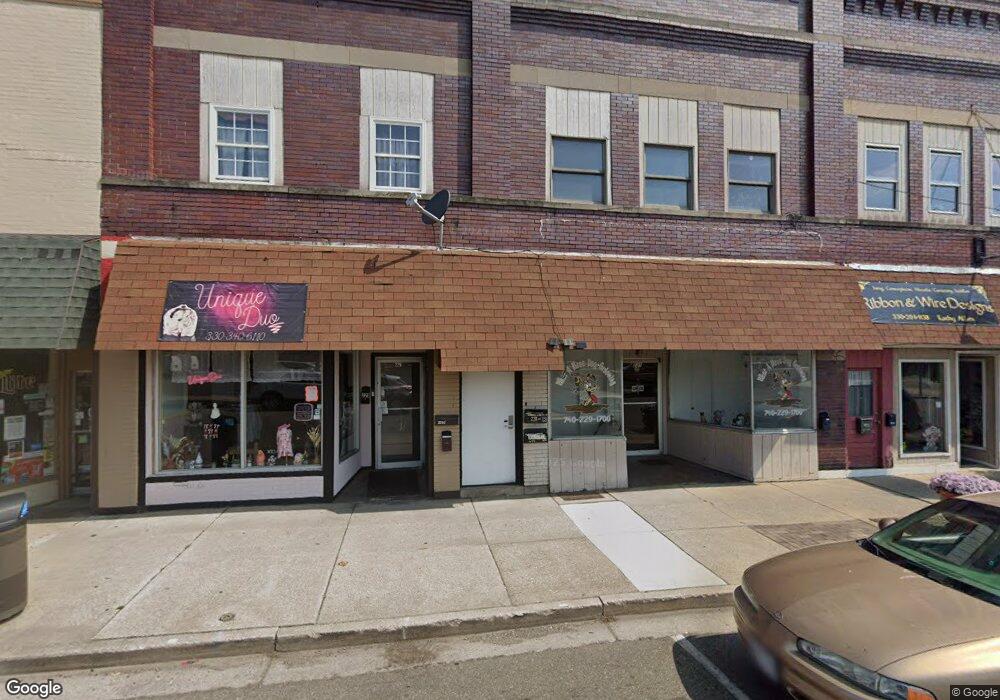
229 E 3rd St Uhrichsville, OH 44683
Studio
--
Bath
3,520
Sq Ft
5,227
Sq Ft Lot
About This Home
This home is located at 229 E 3rd St, Uhrichsville, OH 44683. 229 E 3rd St is a home located in Tuscarawas County with nearby schools including Claymont High School and Immaculate Conception School.
Ownership History
Date
Name
Owned For
Owner Type
Purchase Details
Closed on
Nov 7, 2006
Sold by
Wang Dao Fu and Zheng Jian Hong
Bought by
Allen Ralph H
Home Financials for this Owner
Home Financials are based on the most recent Mortgage that was taken out on this home.
Original Mortgage
$76,558
Outstanding Balance
$50,256
Interest Rate
8.25%
Mortgage Type
Commercial
Purchase Details
Closed on
Sep 1, 2000
Sold by
Ronald Sally J
Bought by
Krocker Mark S and Krocker Michael P
Home Financials for this Owner
Home Financials are based on the most recent Mortgage that was taken out on this home.
Original Mortgage
$67,500
Interest Rate
9.25%
Mortgage Type
Commercial
Purchase Details
Closed on
Sep 22, 1997
Sold by
O'Hara Lisa D
Bought by
Ronald Sally J
Purchase Details
Closed on
May 2, 1995
Sold by
Decker John J
Bought by
Ohara John K and Ohara Lisa D
Home Financials for this Owner
Home Financials are based on the most recent Mortgage that was taken out on this home.
Original Mortgage
$66,850
Interest Rate
8%
Mortgage Type
Commercial
Create a Home Valuation Report for This Property
The Home Valuation Report is an in-depth analysis detailing your home's value as well as a comparison with similar homes in the area
Home Values in the Area
Average Home Value in this Area
Purchase History
| Date | Buyer | Sale Price | Title Company |
|---|---|---|---|
| Allen Ralph H | $75,000 | None Available | |
| Wang Dao Fu | $50,000 | None Available | |
| Krocker Mark S | $75,000 | -- | |
| Ronald Sally J | $74,000 | -- | |
| Ohara John K | $75,000 | -- |
Source: Public Records
Mortgage History
| Date | Status | Borrower | Loan Amount |
|---|---|---|---|
| Open | Allen Ralph H | $76,558 | |
| Previous Owner | Krocker Mark S | $67,500 | |
| Previous Owner | Ohara John K | $66,850 |
Source: Public Records
Tax History
| Year | Tax Paid | Tax Assessment Tax Assessment Total Assessment is a certain percentage of the fair market value that is determined by local assessors to be the total taxable value of land and additions on the property. | Land | Improvement |
|---|---|---|---|---|
| 2024 | $1,923 | $95,760 | $7,790 | $87,970 |
| 2023 | $1,517 | $95,760 | $7,790 | $87,970 |
| 2022 | $1,510 | $33,516 | $2,727 | $30,790 |
| 2021 | $1,321 | $26,335 | $2,524 | $23,811 |
| 2020 | $1,344 | $26,335 | $2,524 | $23,811 |
| 2019 | $1,305 | $26,335 | $2,524 | $23,811 |
| 2018 | $1,318 | $26,330 | $2,520 | $23,810 |
| 2017 | $1,320 | $26,330 | $2,520 | $23,810 |
| 2016 | $757 | $26,330 | $2,520 | $23,810 |
| 2014 | $1,426 | $26,890 | $2,520 | $24,370 |
| 2013 | $1,427 | $26,890 | $2,520 | $24,370 |
Source: Public Records
Map
Nearby Homes
Your Personal Tour Guide
Ask me questions while you tour the home.