229 E Branch St Nipomo, CA 93444
Estimated Value: $513,000 - $690,000
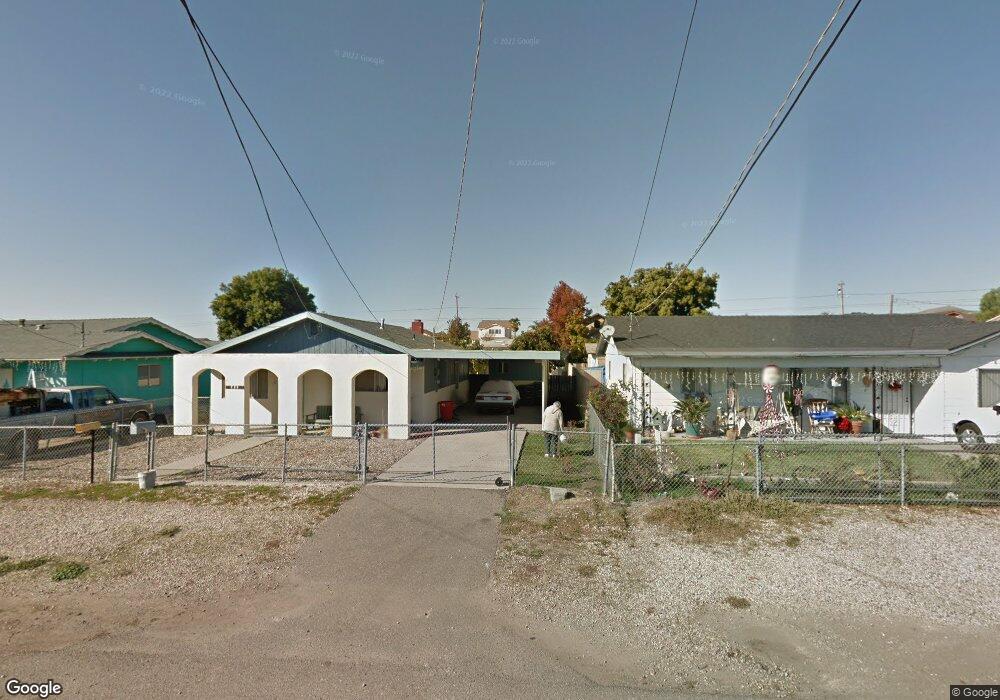
About This Home
This home is located at 229 E Branch St, Nipomo, CA 93444 and is currently estimated at $602,373, approximately $496 per square foot. 229 E Branch St is a home located in San Luis Obispo County with nearby schools including Nipomo Elementary School, Mesa Middle School, and Nipomo High School.
Ownership History
We collect this data history from publicly available records. To have your information removed, we recommend requesting removal directly through your county’s website.
Purchase Details
Home Financials for this Owner
Home Financials are based on the most recent Mortgage that was taken out on this home.Purchase Details
Purchase Details
Purchase Details
Purchase Details
Purchase Details
Purchase Details
Home Financials for this Owner
Home Financials are based on the most recent Mortgage that was taken out on this home.Home Values in the Area
Average Home Value in this Area
Purchase History
We collect this data history from publicly available records. To have your information removed, we recommend requesting removal directly through your county’s website.
| Date | Buyer | Sale Price | Title Company |
|---|---|---|---|
| $535,000 | Placer Title | ||
| -- | None Available | ||
| -- | -- | ||
| -- | None Available | ||
| -- | -- | ||
| -- | -- | ||
| -- | Cuesta Title Guaranty Compan | ||
| -- | Cuesta Title Guaranty Compan |
Mortgage History
We collect this data history from publicly available records. To have your information removed, we recommend requesting removal directly through your county’s website.
| Date | Status | Borrower | Loan Amount |
|---|---|---|---|
| Open | $454,750 | ||
| Previous Owner | $63,000 |
Tax History
We collect this data history from publicly available records. To have your information removed, we recommend requesting removal directly through your county’s website.
| Year | Tax Paid | Tax Assessment Tax Assessment Total Assessment is a certain percentage of the fair market value that is determined by local assessors to be the total taxable value of land and additions on the property. | Land | Improvement |
|---|---|---|---|---|
| 2025 | $3,300 | $545,700 | $331,500 | $214,200 |
| 2024 | $3,260 | $321,503 | $185,528 | $135,975 |
| 2023 | $3,260 | $315,200 | $181,891 | $133,309 |
| 2022 | $3,210 | $309,021 | $178,325 | $130,696 |
| 2021 | $328 | $37,303 | $6,522 | $30,781 |
| 2020 | $323 | $36,922 | $6,456 | $30,466 |
| 2019 | $320 | $36,199 | $6,330 | $29,869 |
| 2018 | $315 | $35,490 | $6,206 | $29,284 |
| 2017 | $307 | $34,795 | $6,085 | $28,710 |
| 2016 | $288 | $34,114 | $5,966 | $28,148 |
| 2015 | $283 | $33,603 | $5,877 | $27,726 |
| 2014 | $271 | $32,945 | $5,762 | $27,183 |
Map
- 247 E Branch St
- 285 E Tefft St
- 182 E Chestnut St
- 260 Beechnut St
- 218 E Tefft St
- 150 E Chestnut St
- 0 S Burton St
- 205 W Tefft St
- 267 W Tefft St
- 400 N Oakglen Ave
- 215 Rancho Rd
- 160 San Antonio Ln
- 449 W Tefft St Unit 5
- 449 W Tefft St Unit 41
- 549 Hill St
- 525 Grande Ave
- 440 N Oakglen Ave
- 545 Grande St
- 230 Hans Place
- 544 S Oakglen Ave
- 232 E Chestnut St
- 230 E Chestnut St
- 248 E Chestnut St
- 224 E Chestnut St
- 220 E Chestnut St
- 254 E Chestnut St
- 275 E Chestnut St
- 285 E Chestnut St
- 265 E Chestnut St
- 235 E Branch St
- 255 E Chestnut St
- 227 E Branch St
- 260 E Chestnut St
- 225 E Branch St
- 212 E Chestnut St
- 221 E Branch St
- 245 E Chestnut St
- 212 Cedarwood Ave
- 268 E Chestnut St
- 270 Dahlia St
Ask me questions while you tour the home.