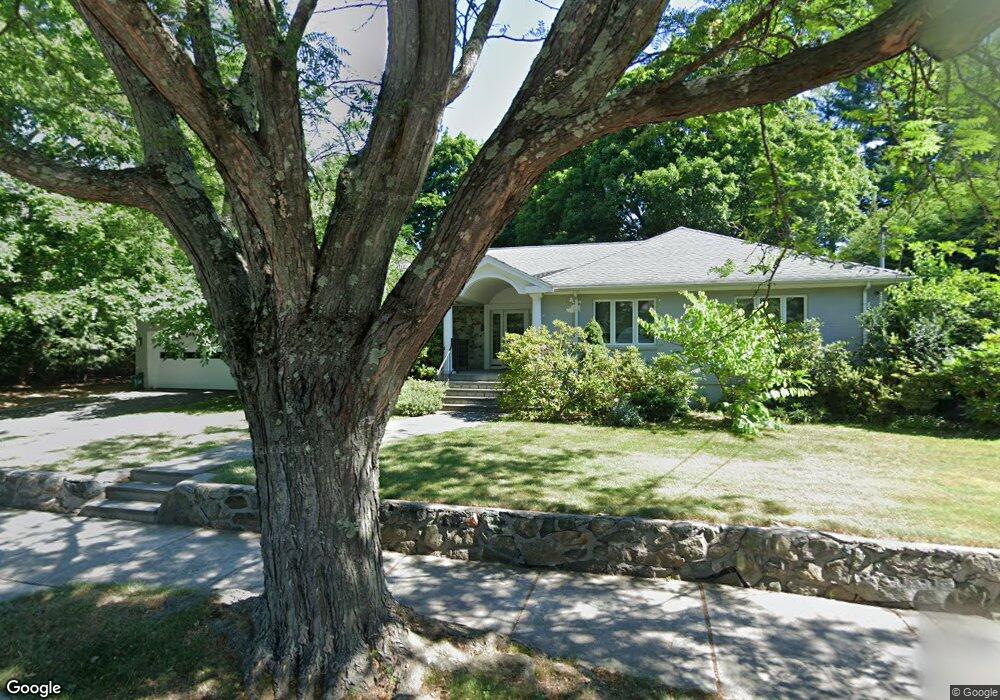
229 Fuller St West Newton, MA 02465
West Newton NeighborhoodEstimated Value: $2,198,000 - $2,469,000
4
Beds
3
Baths
2,598
Sq Ft
$883/Sq Ft
Est. Value
About This Home
This home is located at 229 Fuller St, West Newton, MA 02465 and is currently estimated at $2,292,892, approximately $882 per square foot. 229 Fuller St is a home located in Middlesex County with nearby schools including Peirce Elementary School, F.A. Day Middle School, and Newton North High School.
Ownership History
Date
Name
Owned For
Owner Type
Purchase Details
Closed on
May 19, 2016
Sold by
Rochelle J Phillips Ft
Bought by
Rochelle J Phillip Ft
Current Estimated Value
Purchase Details
Closed on
Aug 25, 1999
Sold by
Segal David and Segal Judith
Bought by
Phillips Nathan and Phillips Rochelle
Home Financials for this Owner
Home Financials are based on the most recent Mortgage that was taken out on this home.
Original Mortgage
$400,000
Interest Rate
7.53%
Mortgage Type
Purchase Money Mortgage
Create a Home Valuation Report for This Property
The Home Valuation Report is an in-depth analysis detailing your home's value as well as a comparison with similar homes in the area
Home Values in the Area
Average Home Value in this Area
Purchase History
| Date | Buyer | Sale Price | Title Company |
|---|---|---|---|
| Rochelle J Phillip Ft | -- | -- | |
| Phillips Nathan | $675,000 | -- |
Source: Public Records
Mortgage History
| Date | Status | Borrower | Loan Amount |
|---|---|---|---|
| Previous Owner | Phillips Nathan | $400,000 | |
| Previous Owner | Phillips Nathan | $120,000 |
Source: Public Records
Tax History Compared to Growth
Tax History
| Year | Tax Paid | Tax Assessment Tax Assessment Total Assessment is a certain percentage of the fair market value that is determined by local assessors to be the total taxable value of land and additions on the property. | Land | Improvement |
|---|---|---|---|---|
| 2025 | $18,722 | $1,910,400 | $1,302,700 | $607,700 |
| 2024 | $18,103 | $1,854,800 | $1,264,800 | $590,000 |
| 2023 | $17,138 | $1,683,500 | $986,600 | $696,900 |
| 2022 | $16,399 | $1,558,800 | $913,500 | $645,300 |
| 2021 | $15,824 | $1,470,600 | $861,800 | $608,800 |
| 2020 | $15,353 | $1,470,600 | $861,800 | $608,800 |
| 2019 | $14,921 | $1,427,800 | $836,700 | $591,100 |
| 2018 | $14,270 | $1,318,900 | $755,600 | $563,300 |
| 2017 | $13,836 | $1,244,200 | $712,800 | $531,400 |
| 2016 | $13,233 | $1,162,800 | $666,200 | $496,600 |
| 2015 | $12,617 | $1,086,700 | $622,600 | $464,100 |
Source: Public Records
Map
Nearby Homes
- 10 Ruane Rd
- 222 Prince St
- 40 Sewall St
- 513 Chestnut St
- 18 Sewall St
- 39 Valentine Park
- 115 Windsor Rd
- 308 Prince St
- 36 Troy Ln
- 1639 Washington St
- 1230 Commonwealth Ave
- 1754 Washington St
- 1430 Beacon St
- 1488 Washington St Unit 1488
- 17 Gilbert St
- 12 Inis Cir
- 283 Woodland Rd
- 51 Bourne St
- 0 Duncan Rd Unit 72925240
- 25 Allen Ave