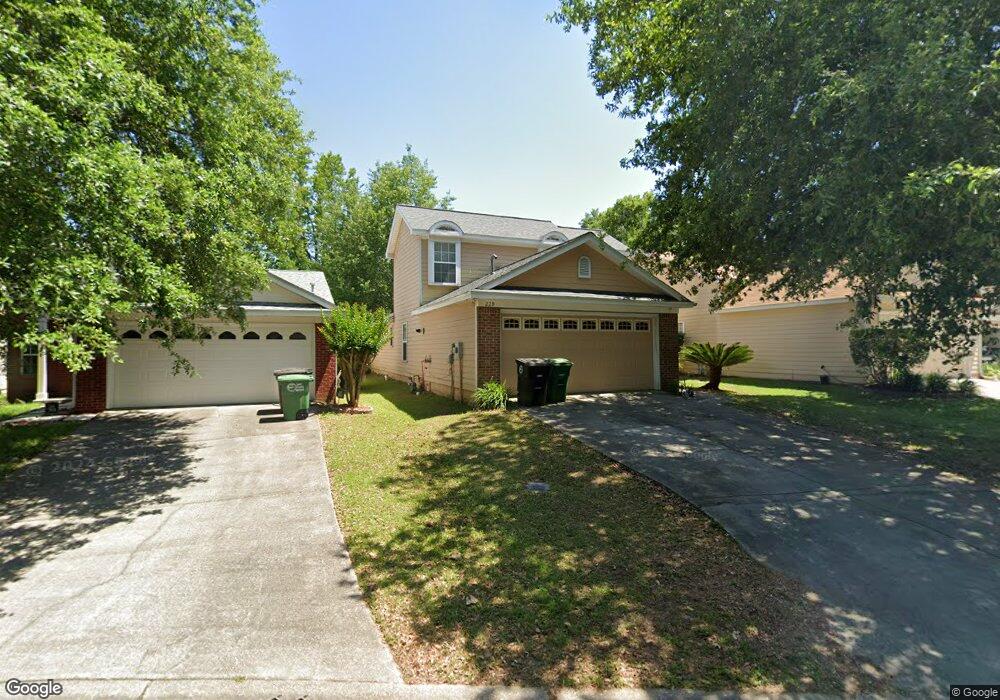
229 Hemley Loop Unit 1 Tallahassee, FL 32312
Lake Jackson NeighborhoodEstimated Value: $309,000 - $325,000
4
Beds
3
Baths
1,641
Sq Ft
$194/Sq Ft
Est. Value
About This Home
This home is located at 229 Hemley Loop Unit 1, Tallahassee, FL 32312 and is currently estimated at $318,355, approximately $194 per square foot. 229 Hemley Loop Unit 1 is a home located in Leon County with nearby schools including Sealey Elementary School, Augusta Raa Middle School, and Leon High School.
Ownership History
Date
Name
Owned For
Owner Type
Purchase Details
Closed on
Mar 30, 2006
Sold by
Mcqueen Laroderick and Mcqueen Keisha R
Bought by
Shugar Kimberly A
Current Estimated Value
Home Financials for this Owner
Home Financials are based on the most recent Mortgage that was taken out on this home.
Original Mortgage
$171,100
Outstanding Balance
$97,586
Interest Rate
6.23%
Mortgage Type
Fannie Mae Freddie Mac
Estimated Equity
$220,769
Purchase Details
Closed on
Nov 27, 2002
Sold by
Edgar Cori P and Edgar Jon R
Bought by
Mcqueen Laroderick
Home Financials for this Owner
Home Financials are based on the most recent Mortgage that was taken out on this home.
Original Mortgage
$150,000
Interest Rate
6.3%
Purchase Details
Closed on
Mar 17, 2000
Sold by
Lakeshore Homes Inc
Bought by
Edgar Jon R and Edgar Cori P
Home Financials for this Owner
Home Financials are based on the most recent Mortgage that was taken out on this home.
Original Mortgage
$123,000
Interest Rate
8.37%
Create a Home Valuation Report for This Property
The Home Valuation Report is an in-depth analysis detailing your home's value as well as a comparison with similar homes in the area
Home Values in the Area
Average Home Value in this Area
Purchase History
| Date | Buyer | Sale Price | Title Company |
|---|---|---|---|
| Shugar Kimberly A | $213,900 | Stewart Title Of Tallahassee | |
| Mcqueen Laroderick | $150,000 | -- | |
| Edgar Jon R | $24,000 | -- | |
| Lakeshore Homes Inc | $24,000 | -- |
Source: Public Records
Mortgage History
| Date | Status | Borrower | Loan Amount |
|---|---|---|---|
| Open | Shugar Kimberly A | $171,100 | |
| Previous Owner | Mcqueen Laroderick | $150,000 | |
| Previous Owner | Lakeshore Homes Inc | $123,000 |
Source: Public Records
Tax History Compared to Growth
Tax History
| Year | Tax Paid | Tax Assessment Tax Assessment Total Assessment is a certain percentage of the fair market value that is determined by local assessors to be the total taxable value of land and additions on the property. | Land | Improvement |
|---|---|---|---|---|
| 2024 | $3,957 | $258,632 | $60,000 | $198,632 |
| 2023 | $3,824 | $248,125 | $0 | $0 |
| 2022 | $3,472 | $231,954 | $52,000 | $179,954 |
| 2021 | $3,220 | $205,062 | $40,000 | $165,062 |
| 2020 | $2,958 | $191,279 | $35,000 | $156,279 |
| 2019 | $2,931 | $186,911 | $35,000 | $151,911 |
| 2018 | $2,806 | $176,512 | $30,000 | $146,512 |
| 2017 | $2,706 | $167,375 | $0 | $0 |
| 2016 | $2,697 | $163,802 | $0 | $0 |
| 2015 | $2,579 | $158,990 | $0 | $0 |
| 2014 | $2,579 | $151,118 | $0 | $0 |
Source: Public Records
Map
Nearby Homes
- 237 Sturgeon Dr
- 240 Sturgeon Dr
- 3306 Lemoyne Ct
- 3204 Remington Run
- 246 Intrepid Ct
- 3481 Lakeshore Dr
- 3411 Deer Lane Dr
- 3513 Deer Lane Dr
- 296 Bermuda Rd
- 407 Locksley Ln
- 2890 Green Forest Ln
- 0 Anton Dr
- 3085 Diddie Rd
- 3429 Lakeshore Dr
- 1826 Lakeshore Ln
- 3025 Grady Rd
- 134 Meadow Wood Ct
- 0 Thomas Rd Unit 379105
- 552 High Oaks Ct
- 3657 Rhoden Hill Way
- 229 Hemley Loop
- 235 Hemley Loop
- 223 Hemley Loop
- 217 Hemley Loop
- 241 Hemley Loop
- 211 Hemley Loop
- 247 Hemley Loop
- 253 Hemley Loop
- 190 Ivernia Loop
- 240 Hemley Loop
- 182 Ivernia Loop
- 196 Ivernia Loop
- 246 Hemley Loop
- 176 Ivernia Loop
- 259 Hemley Loop
- 252 Hemley Loop
- 195 Ivernia Loop
- 265 Hemley Loop
- 258 Hemley Loop Unit 1
- 258 Hemley Loop