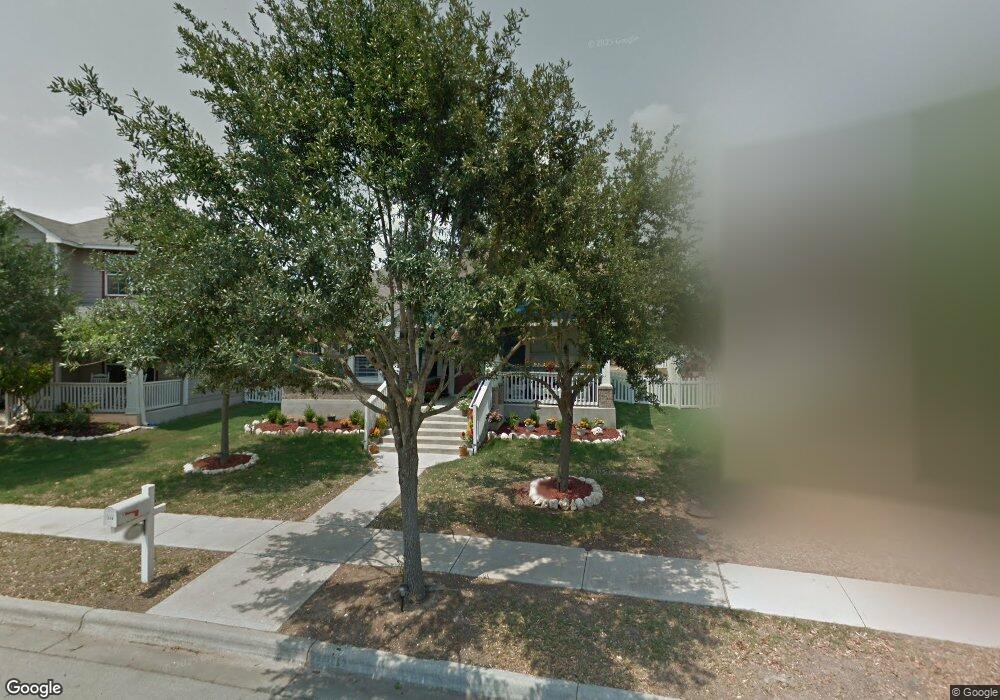
229 Mendez Loop Kyle, TX 78640
Plum Creek NeighborhoodEstimated Value: $302,955 - $383,000
4
Beds
2
Baths
1,838
Sq Ft
$181/Sq Ft
Est. Value
About This Home
This home is located at 229 Mendez Loop, Kyle, TX 78640 and is currently estimated at $331,989, approximately $180 per square foot. 229 Mendez Loop is a home located in Hays County with nearby schools including Laura B Negley Elementary School, R C Barton Middle School, and Jack C Hays High School.
Ownership History
Date
Name
Owned For
Owner Type
Purchase Details
Closed on
Apr 26, 2010
Sold by
Arthur Matthew W and Arthur Carol K
Bought by
Mccormack Clifford Wayne
Current Estimated Value
Home Financials for this Owner
Home Financials are based on the most recent Mortgage that was taken out on this home.
Original Mortgage
$160,930
Outstanding Balance
$107,123
Interest Rate
4.91%
Mortgage Type
FHA
Estimated Equity
$224,866
Create a Home Valuation Report for This Property
The Home Valuation Report is an in-depth analysis detailing your home's value as well as a comparison with similar homes in the area
Home Values in the Area
Average Home Value in this Area
Purchase History
| Date | Buyer | Sale Price | Title Company |
|---|---|---|---|
| Mccormack Clifford Wayne | -- | Independence Title |
Source: Public Records
Mortgage History
| Date | Status | Borrower | Loan Amount |
|---|---|---|---|
| Open | Mccormack Clifford Wayne | $160,930 |
Source: Public Records
Tax History
| Year | Tax Paid | Tax Assessment Tax Assessment Total Assessment is a certain percentage of the fair market value that is determined by local assessors to be the total taxable value of land and additions on the property. | Land | Improvement |
|---|---|---|---|---|
| 2025 | $5,668 | $324,660 | $70,800 | $253,860 |
| 2024 | $70 | $311,870 | $70,800 | $241,070 |
| 2023 | $6,887 | $308,272 | $88,500 | $266,820 |
| 2022 | $6,821 | $280,247 | $75,000 | $279,010 |
| 2021 | $6,760 | $254,770 | $39,200 | $215,570 |
| 2019 | $6,224 | $225,300 | $29,400 | $195,900 |
| 2018 | $6,002 | $216,710 | $21,000 | $195,710 |
| 2017 | $5,681 | $201,520 | $21,000 | $187,780 |
| 2016 | $5,164 | $183,200 | $21,000 | $162,200 |
| 2015 | $4,138 | $173,811 | $21,000 | $153,600 |
Source: Public Records
Map
Nearby Homes
Your Personal Tour Guide
Ask me questions while you tour the home.