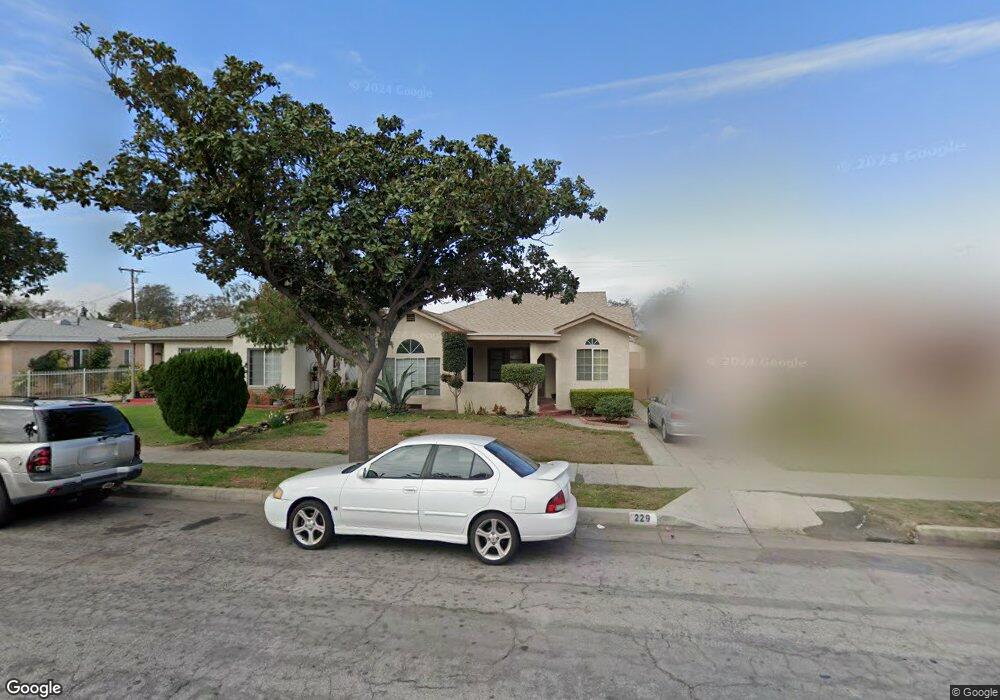
229 N 2nd St Montebello, CA 90640
Estimated Value: $730,703 - $804,000
3
Beds
1
Bath
1,360
Sq Ft
$560/Sq Ft
Est. Value
About This Home
This home is located at 229 N 2nd St, Montebello, CA 90640 and is currently estimated at $761,176, approximately $559 per square foot. 229 N 2nd St is a home located in Los Angeles County with nearby schools including Fremont Elementary School, La Merced Intermediate School, and Montebello High School.
Ownership History
Date
Name
Owned For
Owner Type
Purchase Details
Closed on
Aug 28, 1993
Sold by
Mayfield Jarrell F
Bought by
Quintanar Jose A and Quintanar Margarita
Current Estimated Value
Home Financials for this Owner
Home Financials are based on the most recent Mortgage that was taken out on this home.
Original Mortgage
$136,000
Interest Rate
6.94%
Mortgage Type
Purchase Money Mortgage
Create a Home Valuation Report for This Property
The Home Valuation Report is an in-depth analysis detailing your home's value as well as a comparison with similar homes in the area
Home Values in the Area
Average Home Value in this Area
Purchase History
| Date | Buyer | Sale Price | Title Company |
|---|---|---|---|
| Quintanar Jose A | $170,000 | Stewart Title Company |
Source: Public Records
Mortgage History
| Date | Status | Borrower | Loan Amount |
|---|---|---|---|
| Previous Owner | Quintanar Jose A | $136,000 |
Source: Public Records
Tax History
| Year | Tax Paid | Tax Assessment Tax Assessment Total Assessment is a certain percentage of the fair market value that is determined by local assessors to be the total taxable value of land and additions on the property. | Land | Improvement |
|---|---|---|---|---|
| 2025 | $5,028 | $322,738 | $199,463 | $123,275 |
| 2024 | $5,028 | $316,410 | $195,552 | $120,858 |
| 2023 | $5,007 | $310,207 | $191,718 | $118,489 |
| 2022 | $4,839 | $304,125 | $187,959 | $116,166 |
| 2021 | $4,663 | $298,163 | $184,274 | $113,889 |
| 2019 | $4,451 | $289,321 | $178,809 | $110,512 |
| 2018 | $4,445 | $283,649 | $175,303 | $108,346 |
| 2017 | $4,348 | $278,088 | $171,866 | $106,222 |
| 2016 | $4,253 | $272,637 | $168,497 | $104,140 |
| 2015 | $4,034 | $268,543 | $165,967 | $102,576 |
| 2014 | $3,983 | $263,283 | $162,716 | $100,567 |
Source: Public Records
Map
Nearby Homes
- 132 N 2nd St
- 128 S 2nd St
- 344 N 1st St
- 416 W Cleveland Ave
- 272 Maiden Ln
- 424 Bradley Ave
- 4753 Orange St
- 4724 Orange St
- 633 N 6th St
- 217 Dochan Cir
- 133 N Greenwood Ave
- 704 N Poplar Ave
- 1115 Sheila Ct
- 8421 Culp Dr
- 229 S 10th St
- 653 N Raywood Ave
- 708 Katherine Dr
- 219 S Greenwood Ave
- 415 S 6th St
- 713 N Orcutt Dr
- 233 N 2nd St
- 225 N 2nd St
- 237 N 2nd St
- 221 N 2nd St
- 228 N 3rd St
- 219 N 2nd St
- 224 N 3rd St
- 232 N 3rd St
- 241 N 2nd St
- 236 N 3rd St
- 220 N 3rd St
- 116 W Fremont Square
- 213 N 2nd St
- 205 W Madison Ave
- 216 N 3rd St
- 209 W Madison Ave
- 215 W Madison Ave
- 201 W Madison Ave
- 117 W Fremont Square
- 110 W Fremont Square
Your Personal Tour Guide
Ask me questions while you tour the home.