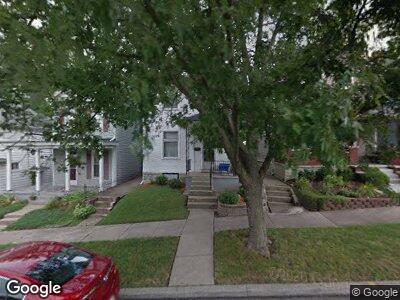
229 N D St Hamilton, OH 45013
Estimated Value: $153,000 - $208,000
3
Beds
2
Baths
1,870
Sq Ft
$97/Sq Ft
Est. Value
About This Home
This home is located at 229 N D St, Hamilton, OH 45013 and is currently estimated at $181,938, approximately $97 per square foot. 229 N D St is a home located in Butler County with nearby schools including Bridgeport Elementary School, Wilson Middle School, and Hamilton High School Main Campus.
Ownership History
Date
Name
Owned For
Owner Type
Purchase Details
Closed on
Oct 6, 2009
Sold by
Baumann Daniel A and Baumann Melinda R
Bought by
Hardy William Lloyd and Hardy Gayle A
Current Estimated Value
Purchase Details
Closed on
Jan 18, 2007
Sold by
Tri State Investment Trust Inc
Bought by
Baumann Melinda R
Home Financials for this Owner
Home Financials are based on the most recent Mortgage that was taken out on this home.
Original Mortgage
$76,100
Interest Rate
9.89%
Mortgage Type
Construction
Purchase Details
Closed on
Jan 17, 2007
Sold by
Kuykendall Daniel Mark and Kuykendall William A
Bought by
Tristate Investment Trust Inc
Home Financials for this Owner
Home Financials are based on the most recent Mortgage that was taken out on this home.
Original Mortgage
$76,100
Interest Rate
9.89%
Mortgage Type
Construction
Create a Home Valuation Report for This Property
The Home Valuation Report is an in-depth analysis detailing your home's value as well as a comparison with similar homes in the area
Home Values in the Area
Average Home Value in this Area
Purchase History
| Date | Buyer | Sale Price | Title Company |
|---|---|---|---|
| Hardy William Lloyd | $28,100 | None Available | |
| Baumann Melinda R | $49,900 | Attorney | |
| Tristate Investment Trust Inc | $45,000 | Attorney | |
| Tristate Investment Trust Inc | -- | Attorney |
Source: Public Records
Mortgage History
| Date | Status | Borrower | Loan Amount |
|---|---|---|---|
| Previous Owner | Baumann Melinda R | $77,000 | |
| Previous Owner | Baumann Melinda R | $76,100 |
Source: Public Records
Tax History Compared to Growth
Tax History
| Year | Tax Paid | Tax Assessment Tax Assessment Total Assessment is a certain percentage of the fair market value that is determined by local assessors to be the total taxable value of land and additions on the property. | Land | Improvement |
|---|---|---|---|---|
| 2024 | $1,641 | $37,890 | $3,140 | $34,750 |
| 2023 | $1,634 | $37,560 | $3,140 | $34,420 |
| 2022 | $1,347 | $26,190 | $3,140 | $23,050 |
| 2021 | $1,172 | $25,220 | $3,140 | $22,080 |
| 2020 | $1,221 | $25,220 | $3,140 | $22,080 |
| 2019 | $1,437 | $19,630 | $3,060 | $16,570 |
| 2018 | $939 | $19,630 | $3,060 | $16,570 |
| 2017 | $947 | $19,630 | $3,060 | $16,570 |
| 2016 | $986 | $19,480 | $3,060 | $16,420 |
| 2015 | $980 | $19,480 | $3,060 | $16,420 |
| 2014 | $934 | $19,480 | $3,060 | $16,420 |
| 2013 | $934 | $19,760 | $5,090 | $14,670 |
Source: Public Records
Map
Nearby Homes