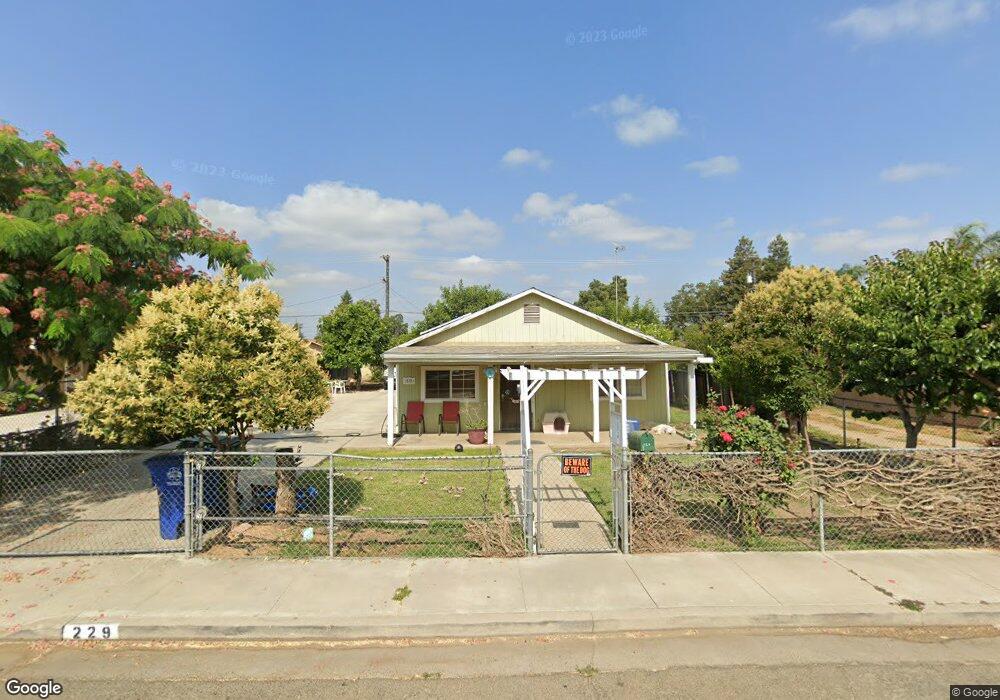
229 N Dwight Ave Farmersville, CA 93223
Estimated Value: $242,000 - $289,000
4
Beds
2
Baths
1,274
Sq Ft
$202/Sq Ft
Est. Value
About This Home
This home is located at 229 N Dwight Ave, Farmersville, CA 93223 and is currently estimated at $256,982, approximately $201 per square foot. 229 N Dwight Ave is a home located in Tulare County with nearby schools including J.E. Hester Elementary School, George L. Snowden Elementary School, and Freedom Elementary School.
Ownership History
Date
Name
Owned For
Owner Type
Purchase Details
Closed on
Jul 17, 2018
Sold by
Torres Simon and Torres Marissa
Bought by
Torres Marissa
Current Estimated Value
Purchase Details
Closed on
May 6, 2013
Sold by
Torres Marissa
Bought by
Torres Simon and Torres Marissa
Home Financials for this Owner
Home Financials are based on the most recent Mortgage that was taken out on this home.
Original Mortgage
$69,300
Outstanding Balance
$15,040
Interest Rate
3.41%
Mortgage Type
New Conventional
Estimated Equity
$241,942
Purchase Details
Closed on
Jun 8, 2009
Sold by
Torres Simon H
Bought by
Torres Marissa
Purchase Details
Closed on
Aug 31, 2006
Sold by
Torres Simon H
Bought by
Torres Simon H
Home Financials for this Owner
Home Financials are based on the most recent Mortgage that was taken out on this home.
Original Mortgage
$75,000
Interest Rate
7.5%
Mortgage Type
Purchase Money Mortgage
Create a Home Valuation Report for This Property
The Home Valuation Report is an in-depth analysis detailing your home's value as well as a comparison with similar homes in the area
Home Values in the Area
Average Home Value in this Area
Purchase History
| Date | Buyer | Sale Price | Title Company |
|---|---|---|---|
| Torres Marissa | -- | None Available | |
| Torres Simon | -- | Servicelink | |
| Torres Marissa | $73,000 | None Available | |
| Torres Simon H | -- | Financial Title Company |
Source: Public Records
Mortgage History
| Date | Status | Borrower | Loan Amount |
|---|---|---|---|
| Open | Torres Simon | $69,300 | |
| Previous Owner | Torres Simon H | $75,000 |
Source: Public Records
Tax History Compared to Growth
Tax History
| Year | Tax Paid | Tax Assessment Tax Assessment Total Assessment is a certain percentage of the fair market value that is determined by local assessors to be the total taxable value of land and additions on the property. | Land | Improvement |
|---|---|---|---|---|
| 2025 | $1,062 | $96,254 | $25,252 | $71,002 |
| 2024 | $1,062 | $94,367 | $24,757 | $69,610 |
| 2023 | $1,064 | $92,518 | $24,272 | $68,246 |
| 2022 | $986 | $90,705 | $23,797 | $66,908 |
| 2021 | $967 | $88,926 | $23,330 | $65,596 |
| 2020 | $955 | $88,014 | $23,091 | $64,923 |
| 2019 | $969 | $86,288 | $22,638 | $63,650 |
| 2018 | $939 | $84,596 | $22,194 | $62,402 |
| 2017 | $952 | $82,937 | $21,759 | $61,178 |
| 2016 | $896 | $81,310 | $21,332 | $59,978 |
| 2015 | $731 | $80,089 | $21,012 | $59,077 |
| 2014 | $731 | $67,000 | $17,000 | $50,000 |
Source: Public Records
Map
Nearby Homes
- 738 E Larry St
- 680 E Larry St
- 885 E Ash St
- 903 E Ash St
- 732 N Dwight Ave
- 438 N Magnolia Ave
- 753 N Brundage Ave
- 209 S Magnolia Ave
- 528 S Camelia Ave
- 327 S Farmersville Blvd
- 701 Farmersville Rd
- 896 Farmersville Rd
- 245 W Oakland St
- 0 S Farmersville Blvd Unit 238390
- 322 E Citrus Dr
- 0 Avenue 288
- 896 N Mariposa Ave
- 1643 Tehama Ave
- 0 Avenue 288
- 391 Teddy St
- 203 N Dwight Ave
- 245 N Dwight Ave
- 234 N Gene Ave
- 271 N Dwight Ave
- 208 N Gene Ave
- 256 N Gene Ave
- 182 N Dwight Ave
- 186 N Gene Ave
- 291 N Dwight Ave
- 224 N Dwight Ave
- 210 N Dwight Ave
- 246 N Dwight Ave
- 198 N Dwight Ave
- 168 N Dwight Ave
- 270 N Dwight Ave
- 309 N Dwight Ave
- 152 N Dwight Ave
- 898 E Visalia Rd
- 237 N Gene Ave
- 329 N Dwight Ave