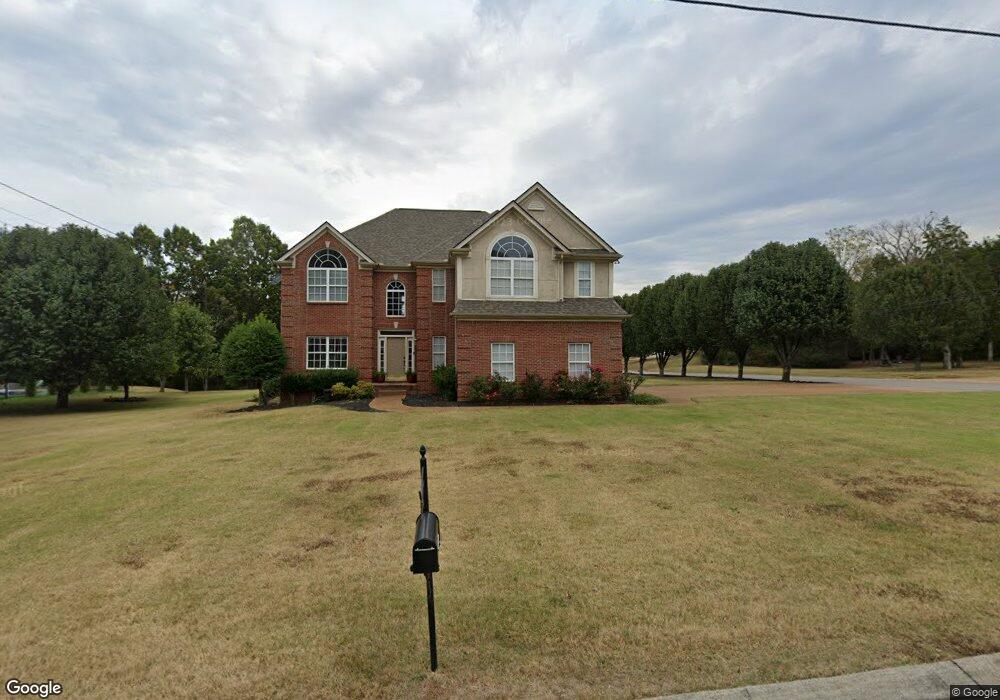
229 Norfolk Ln Nolensville, TN 37135
Estimated Value: $734,000 - $872,000
--
Bed
4
Baths
2,879
Sq Ft
$273/Sq Ft
Est. Value
About This Home
This home is located at 229 Norfolk Ln, Nolensville, TN 37135 and is currently estimated at $784,726, approximately $272 per square foot. 229 Norfolk Ln is a home located in Williamson County with nearby schools including Nolensville Elementary School, Mill Creek Middle School, and Nolensville High School.
Ownership History
Date
Name
Owned For
Owner Type
Purchase Details
Closed on
Dec 9, 2015
Sold by
Denton Marilyn H
Bought by
Denton Marilyn H and Rice Bridgette
Current Estimated Value
Purchase Details
Closed on
Aug 3, 2012
Sold by
Good David Allen and Goon Lisa Swafford
Bought by
Denton Marilyn H
Home Financials for this Owner
Home Financials are based on the most recent Mortgage that was taken out on this home.
Original Mortgage
$281,801
Outstanding Balance
$192,951
Interest Rate
3.5%
Mortgage Type
FHA
Estimated Equity
$591,775
Purchase Details
Closed on
Apr 15, 1998
Sold by
Fox Ridge Homes Inc
Bought by
Goon David Allen and Goon Lisa Swafford
Home Financials for this Owner
Home Financials are based on the most recent Mortgage that was taken out on this home.
Original Mortgage
$160,000
Interest Rate
7.09%
Create a Home Valuation Report for This Property
The Home Valuation Report is an in-depth analysis detailing your home's value as well as a comparison with similar homes in the area
Home Values in the Area
Average Home Value in this Area
Purchase History
| Date | Buyer | Sale Price | Title Company |
|---|---|---|---|
| Denton Marilyn H | -- | Foundation Title & Escrow Ll | |
| Denton Marilyn H | $287,000 | Foundation Title & Escrow Se | |
| Goon David Allen | $218,438 | -- |
Source: Public Records
Mortgage History
| Date | Status | Borrower | Loan Amount |
|---|---|---|---|
| Open | Denton Marilyn H | $281,801 | |
| Previous Owner | Goon David Allen | $160,000 |
Source: Public Records
Tax History Compared to Growth
Tax History
| Year | Tax Paid | Tax Assessment Tax Assessment Total Assessment is a certain percentage of the fair market value that is determined by local assessors to be the total taxable value of land and additions on the property. | Land | Improvement |
|---|---|---|---|---|
| 2025 | $2,596 | $189,600 | $47,500 | $142,100 |
| 2024 | $2,596 | $119,625 | $21,250 | $98,375 |
| 2023 | $2,596 | $119,625 | $21,250 | $98,375 |
| 2022 | $2,596 | $119,625 | $21,250 | $98,375 |
| 2021 | $2,596 | $119,625 | $21,250 | $98,375 |
| 2020 | $2,375 | $94,650 | $16,250 | $78,400 |
| 2019 | $2,243 | $94,650 | $16,250 | $78,400 |
| 2018 | $2,177 | $94,650 | $16,250 | $78,400 |
| 2017 | $2,158 | $94,650 | $16,250 | $78,400 |
| 2016 | $2,130 | $94,650 | $16,250 | $78,400 |
| 2015 | -- | $75,575 | $12,500 | $63,075 |
| 2014 | -- | $75,575 | $12,500 | $63,075 |
Source: Public Records
Map
Nearby Homes
- 625 Mer Rouge Dr
- 373 Baronswood Dr
- 825 Piccadilly Dr
- 1115 Oak Creek Dr
- 607 Quarter Horse Ln
- Ansley Plan at The Mill at McFarlin - Estates Series
- Kingston Plan at The Mill at McFarlin - Estates Series
- Weston Plan at The Mill at McFarlin - Estates Series
- Buchanan Plan at The Mill at McFarlin - Estates Series
- 1228 Countryside Rd
- 2248 Rolling Hills Dr
- 2207 Potter Place
- 720 Stonecastle Place
- 2276 Rolling Hills Dr
- 2211 Potter Place
- 0 Nolensville Rd Unit RTC2807764
- 0 Nolensville Rd Unit RTC2818506
- 0 Bostic Unit RTC2516475
- 0 Nolensville Rd Unit RTC3017763
- 4137 Brendlyn Dr
- 225 Norfolk Ln
- 231 Norfolk Ln
- 305 Baronswood Dr
- 223 Norfolk Ln
- 226 Norfolk Ln
- 228 Norfolk Ln
- 304 Baronswood Dr
- 301 Norfolk Ct
- 230 Norfolk Ln
- 309 Baronswood Dr
- 221 Norfolk Ln
- 222 Norfolk Ln
- 308 Baronswood Dr
- 305 Norfolk Ct
- 313 Baronswood Dr
- 236 Norfolk Ln
- 220 Norfolk Ln
- 633 Mer Rouge Dr
- 300 Norfolk Ct
- 635 Mer Rouge Dr