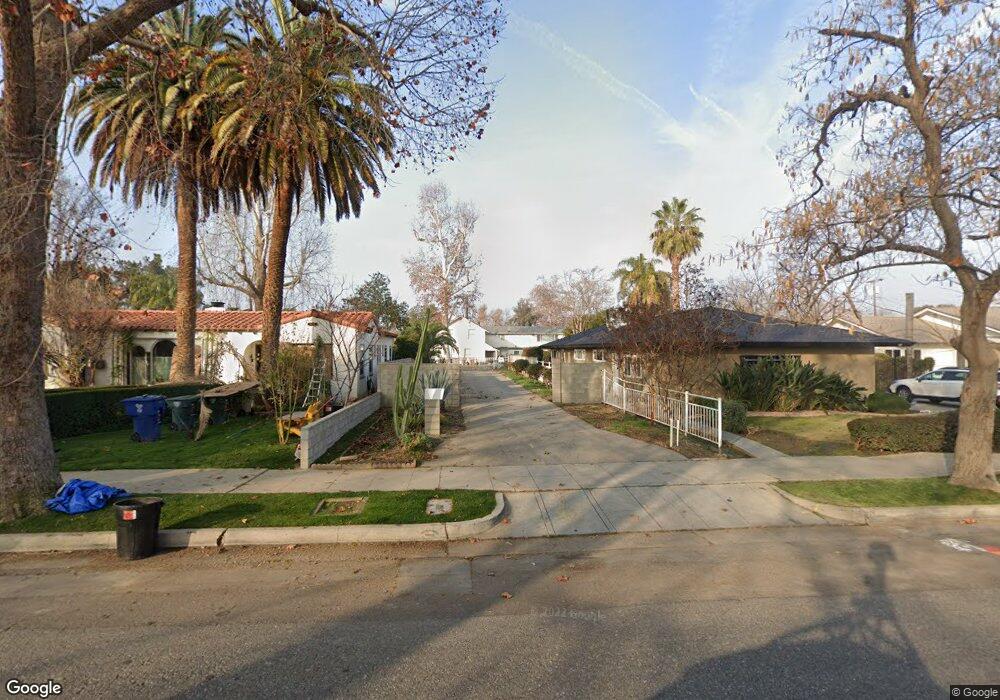
229 Oleander Ave Bakersfield, CA 93304
Oleander-Sunset NeighborhoodEstimated Value: $352,000 - $678,000
7
Beds
4
Baths
2,580
Sq Ft
$203/Sq Ft
Est. Value
About This Home
This home is located at 229 Oleander Ave, Bakersfield, CA 93304 and is currently estimated at $523,955, approximately $203 per square foot. 229 Oleander Ave is a home located in Kern County with nearby schools including Roosevelt Elementary School, Emerson Middle School, and Bakersfield High School.
Ownership History
Date
Name
Owned For
Owner Type
Purchase Details
Closed on
Feb 17, 2004
Sold by
Solomon Mark Elliott
Bought by
Solomon Lori Lee
Current Estimated Value
Home Financials for this Owner
Home Financials are based on the most recent Mortgage that was taken out on this home.
Original Mortgage
$217,500
Outstanding Balance
$119,033
Interest Rate
8.3%
Mortgage Type
New Conventional
Estimated Equity
$404,922
Purchase Details
Closed on
Dec 19, 1996
Sold by
Seidel Thomas E and Seidel Vicki R
Bought by
Bankers Trust Company and Greenwich Capital Acceptance Inc
Create a Home Valuation Report for This Property
The Home Valuation Report is an in-depth analysis detailing your home's value as well as a comparison with similar homes in the area
Home Values in the Area
Average Home Value in this Area
Purchase History
| Date | Buyer | Sale Price | Title Company |
|---|---|---|---|
| Solomon Lori Lee | -- | Ticor Title | |
| Bankers Trust Company | $123,735 | Fidelity National Title Ins |
Source: Public Records
Mortgage History
| Date | Status | Borrower | Loan Amount |
|---|---|---|---|
| Open | Solomon Lori Lee | $217,500 |
Source: Public Records
Tax History
| Year | Tax Paid | Tax Assessment Tax Assessment Total Assessment is a certain percentage of the fair market value that is determined by local assessors to be the total taxable value of land and additions on the property. | Land | Improvement |
|---|---|---|---|---|
| 2025 | $3,285 | $200,314 | $31,394 | $168,920 |
| 2024 | $3,285 | $196,388 | $30,779 | $165,609 |
| 2023 | $3,212 | $192,538 | $30,176 | $162,362 |
| 2022 | $3,126 | $188,765 | $29,585 | $159,180 |
| 2021 | $2,984 | $185,065 | $29,005 | $156,060 |
| 2020 | $2,937 | $183,169 | $28,708 | $154,461 |
| 2019 | $2,877 | $183,169 | $28,708 | $154,461 |
| 2018 | $2,811 | $176,059 | $27,595 | $148,464 |
| 2017 | $2,790 | $172,607 | $27,054 | $145,553 |
| 2016 | $2,297 | $136,871 | $26,524 | $110,347 |
| 2015 | $2,276 | $134,816 | $26,126 | $108,690 |
| 2014 | $2,202 | $132,176 | $25,615 | $106,561 |
Source: Public Records
Map
Nearby Homes
Your Personal Tour Guide
Ask me questions while you tour the home.