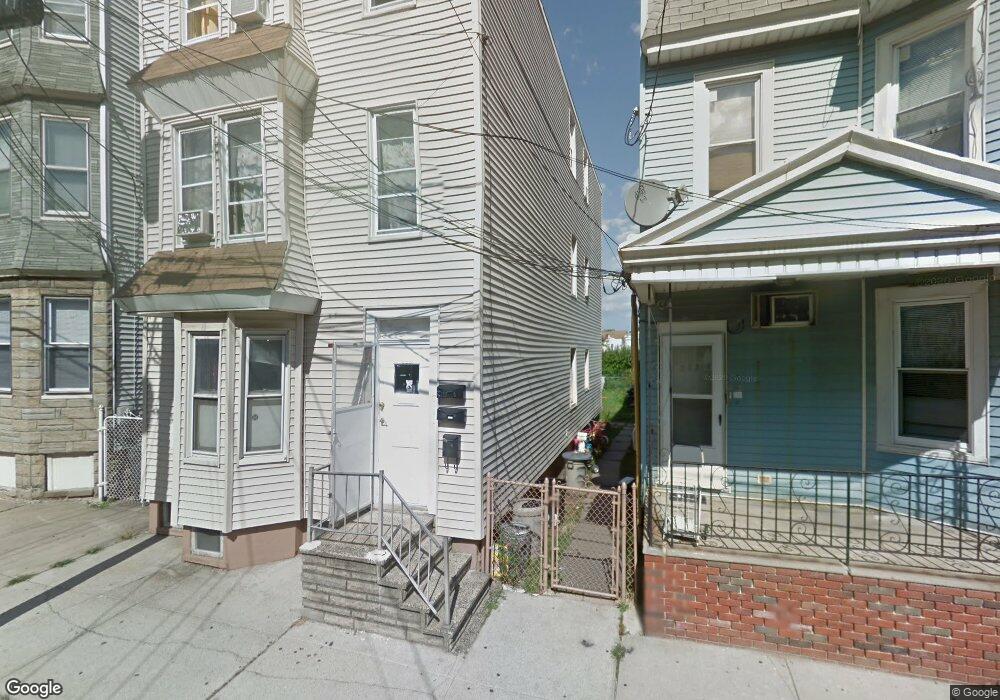
229 Patterson St Unit 2 Harrison, NJ 07029
Estimated Value: $666,050 - $713,000
6
Beds
3
Baths
2,587
Sq Ft
$264/Sq Ft
Est. Value
About This Home
This home is located at 229 Patterson St Unit 2, Harrison, NJ 07029 and is currently estimated at $683,263, approximately $264 per square foot. 229 Patterson St Unit 2 is a home located in Hudson County with nearby schools including Kennedy Elementary School, Lincoln No. 3 Elementary School, and Hamilton Intermediate School.
Ownership History
Date
Name
Owned For
Owner Type
Purchase Details
Closed on
May 14, 2018
Sold by
Is Realty Holdings Llc
Bought by
Hansan Syedi L
Current Estimated Value
Home Financials for this Owner
Home Financials are based on the most recent Mortgage that was taken out on this home.
Original Mortgage
$287,000
Outstanding Balance
$171,080
Interest Rate
4.6%
Mortgage Type
New Conventional
Estimated Equity
$512,183
Purchase Details
Closed on
Jan 25, 2017
Sold by
Ramirez Luis and Mortgage Electronic Registrati
Bought by
Is Realty Holdings Llc
Home Financials for this Owner
Home Financials are based on the most recent Mortgage that was taken out on this home.
Original Mortgage
$245,000
Interest Rate
3.88%
Mortgage Type
Commercial
Purchase Details
Closed on
Sep 23, 2004
Sold by
Strenkowski Genevieve and Estate Of Anthony Balaszkiewic
Bought by
Strenkowski Genevieve
Create a Home Valuation Report for This Property
The Home Valuation Report is an in-depth analysis detailing your home's value as well as a comparison with similar homes in the area
Home Values in the Area
Average Home Value in this Area
Purchase History
| Date | Buyer | Sale Price | Title Company |
|---|---|---|---|
| Hansan Syedi L | $409,000 | Old Republic Natl Ins Co | |
| Is Realty Holdings Llc | $280,000 | None Available | |
| Strenkowski Genevieve | -- | -- |
Source: Public Records
Mortgage History
| Date | Status | Borrower | Loan Amount |
|---|---|---|---|
| Open | Hansan Syedi L | $287,000 | |
| Previous Owner | Is Realty Holdings Llc | $245,000 |
Source: Public Records
Tax History
| Year | Tax Paid | Tax Assessment Tax Assessment Total Assessment is a certain percentage of the fair market value that is determined by local assessors to be the total taxable value of land and additions on the property. | Land | Improvement |
|---|---|---|---|---|
| 2025 | $10,489 | $447,100 | $210,000 | $237,100 |
| 2024 | $10,279 | $447,100 | $210,000 | $237,100 |
Source: Public Records
Map
Nearby Homes
- 229 Patterson St
- 308 Davis Ave
- 430 Central Ave
- 419 Hamilton St
- 425 Cleveland Ave
- 615 Harrison Ave
- 607 Frank E Rodgers Blvd N
- 323 William St
- 316 William St
- 743 Harrison Ave
- 131 Dukes St
- 214 William St
- 405 7th St
- 441 John St
- 209 Hamilton St
- 53 Devon Terrace
- 18 Schuyler Ave
- 118 Maple St
- 153 Devon St
- 202 Devon St
- 227 Patterson St
- 225 Patterson St
- 407 Cross St
- 235 Patterson St
- 405 Cross St
- 221-223 Paterson St Unit 3
- 221-223 Paterson St
- 221 Patterson St Unit 223
- 221 Paterson St Unit 3
- 409 Cross St
- 409 Cross St Unit 2
- 601 William St
- 603 William St
- 411 Cross St
- 119 Patterson St
- 119 Patterson St Unit 1
- 119 Patterson St Unit 2
- 230 Patterson St
- 232 Patterson St
- 228 Patterson St Unit 1
Your Personal Tour Guide
Ask me questions while you tour the home.