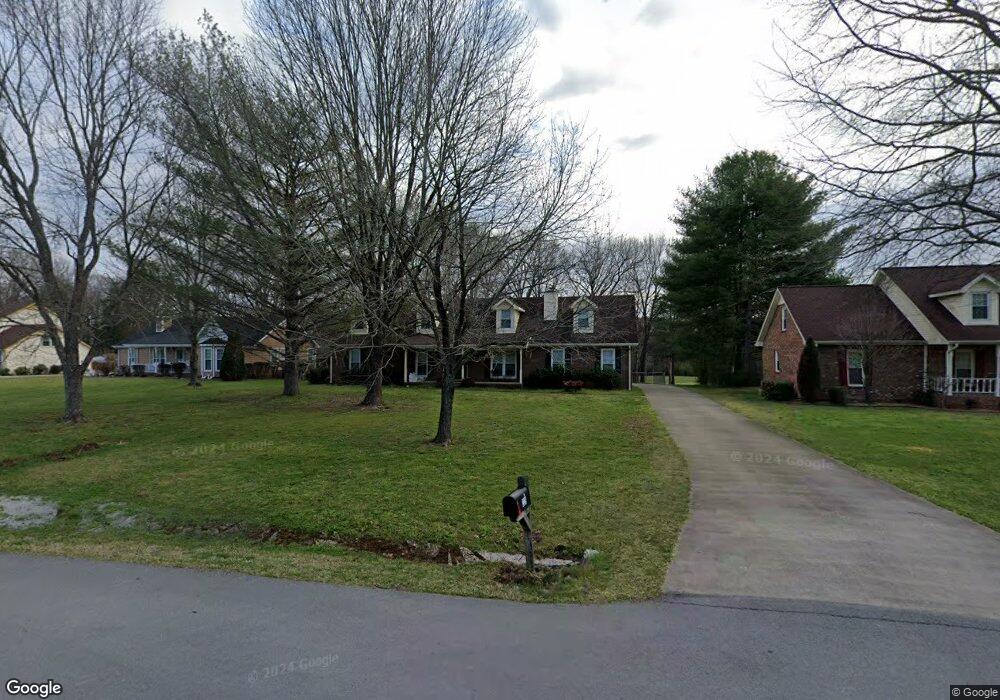
229 Quail Ridge Rd Smyrna, TN 37167
Estimated Value: $409,515 - $490,000
--
Bed
2
Baths
2,235
Sq Ft
$206/Sq Ft
Est. Value
About This Home
This home is located at 229 Quail Ridge Rd, Smyrna, TN 37167 and is currently estimated at $459,379, approximately $205 per square foot. 229 Quail Ridge Rd is a home located in Rutherford County with nearby schools including Stewarts Creek Elementary School, Stewarts Creek Middle School, and Stewarts Creek High School.
Ownership History
Date
Name
Owned For
Owner Type
Purchase Details
Closed on
Jan 8, 2018
Sold by
Pmc Sfr Holding Llc
Bought by
Pmc Sfr Borrower Llc
Current Estimated Value
Purchase Details
Closed on
Jun 23, 2017
Sold by
Wilmington Savings Fund Society
Bought by
Pretium Sfr Holding Llc
Purchase Details
Closed on
Aug 29, 2016
Sold by
Chaffin Bonnie L and Chaffin Darren J
Bought by
Willington Savings Fund Society and Christiana Trust
Purchase Details
Closed on
Jul 2, 2007
Sold by
Eddy Reynolds
Bought by
Chaffin Darren J and Chaffin Bonnie L
Home Financials for this Owner
Home Financials are based on the most recent Mortgage that was taken out on this home.
Original Mortgage
$229,491
Interest Rate
6.37%
Purchase Details
Closed on
Jul 28, 2006
Sold by
Kelso Ivan B
Bought by
Reynolds and Par
Home Financials for this Owner
Home Financials are based on the most recent Mortgage that was taken out on this home.
Original Mortgage
$175,200
Interest Rate
6.74%
Create a Home Valuation Report for This Property
The Home Valuation Report is an in-depth analysis detailing your home's value as well as a comparison with similar homes in the area
Home Values in the Area
Average Home Value in this Area
Purchase History
| Date | Buyer | Sale Price | Title Company |
|---|---|---|---|
| Pmc Sfr Borrower Llc | -- | Os National Llc | |
| Pretium Sfr Holding Llc | $415,900 | None Available | |
| Willington Savings Fund Society | $221,016 | None Available | |
| Chaffin Darren J | $234,900 | -- | |
| Reynolds | $219,000 | -- |
Source: Public Records
Mortgage History
| Date | Status | Borrower | Loan Amount |
|---|---|---|---|
| Previous Owner | Reynolds | $229,491 | |
| Previous Owner | Reynolds | $175,200 | |
| Previous Owner | Reynolds | $43,800 |
Source: Public Records
Tax History Compared to Growth
Tax History
| Year | Tax Paid | Tax Assessment Tax Assessment Total Assessment is a certain percentage of the fair market value that is determined by local assessors to be the total taxable value of land and additions on the property. | Land | Improvement |
|---|---|---|---|---|
| 2025 | $1,637 | $87,275 | $13,750 | $73,525 |
| 2024 | $1,637 | $87,275 | $13,750 | $73,525 |
| 2023 | $1,637 | $87,275 | $13,750 | $73,525 |
| 2022 | $1,411 | $87,275 | $13,750 | $73,525 |
| 2021 | $1,353 | $60,950 | $10,625 | $50,325 |
| 2020 | $1,353 | $60,950 | $10,625 | $50,325 |
| 2019 | $1,353 | $60,950 | $10,625 | $50,325 |
| 2018 | $1,280 | $60,950 | $0 | $0 |
| 2017 | $1,139 | $42,500 | $0 | $0 |
| 2016 | $1,139 | $42,500 | $0 | $0 |
| 2015 | $1,139 | $42,500 | $0 | $0 |
| 2014 | $1,057 | $42,500 | $0 | $0 |
| 2013 | -- | $38,475 | $0 | $0 |
Source: Public Records
Map
Nearby Homes
- 235 Quail Ridge Rd
- 221 Snapdragon Dr
- 108 Wintergreen Ct
- 205 Peebles Dr
- 1017 Altavista Ln
- 838 Seven Oaks Blvd
- 527 Hawk Cove
- 511 Milesdale Ln
- 102 Sundown Dr
- 932 Ca Veat Cir
- 235 Pleasant Run Rd
- 402 Tonalist Way
- 230 Appleby Ct
- 712 Stewart Valley Dr
- 368 Sarava Ln
- 317 Sarava Ln
- 260 Pleasant Run Rd
- 748 Baker Rd
- 801 Pleasant Run Rd
- 2090 Caladonia Way
- 227 Quail Ridge Rd
- 231 Quail Ridge Rd
- 225 Quail Ridge Rd
- 233 Quail Ridge Rd
- 230 Quail Ridge Rd
- 228 Quail Ridge Rd
- 232 Quail Ridge Rd
- 226 Quail Ridge Rd
- 234 Quail Ridge Rd
- 223 Quail Ridge Rd
- 224 Quail Ridge Rd
- 236 Quail Ridge Rd
- 237 Quail Ridge Rd
- 221 Quail Ridge Rd
- 222 Quail Ridge Rd
- 238 Quail Ridge Rd
- 239 Quail Ridge Rd
- 219 Quail Ridge Rd
- 220 Quail Ridge Rd
- 241 Quail Ridge Rd