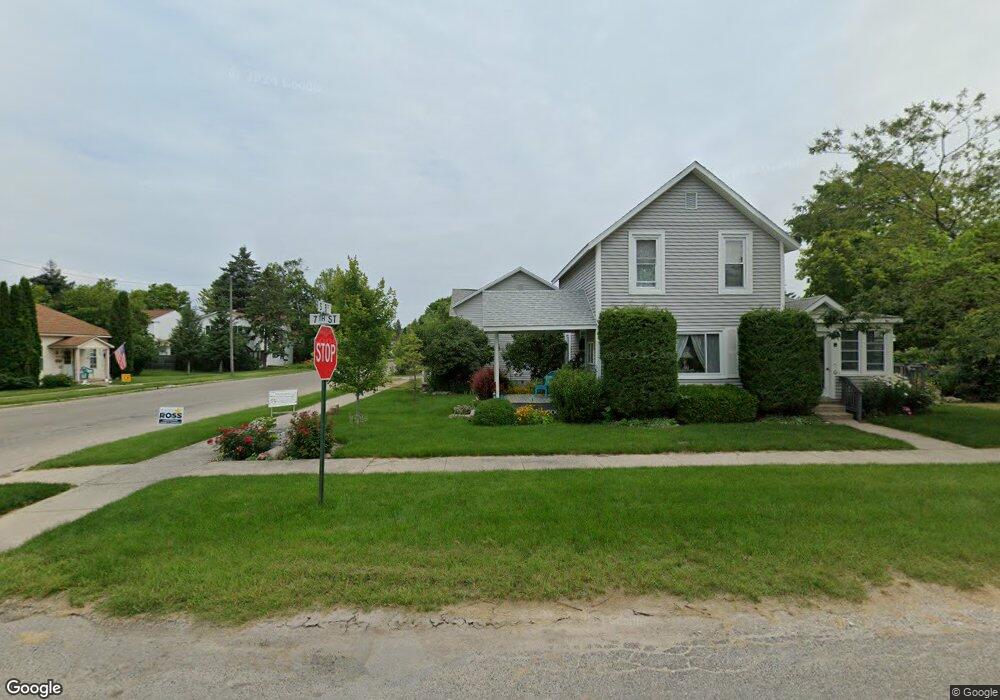
229 S B St Cheboygan, MI 49721
Estimated Value: $99,000 - $176,000
--
Bed
--
Bath
1,490
Sq Ft
$96/Sq Ft
Est. Value
About This Home
This home is located at 229 S B St, Cheboygan, MI 49721 and is currently estimated at $142,604, approximately $95 per square foot. 229 S B St is a home located in Cheboygan County with nearby schools including East Elementary School, Cheboygan Intermediate School, and Cheboygan Area High School.
Ownership History
Date
Name
Owned For
Owner Type
Purchase Details
Closed on
Mar 24, 2023
Sold by
Mendrick Gloria
Bought by
Cash 4 Cars Inc
Current Estimated Value
Home Financials for this Owner
Home Financials are based on the most recent Mortgage that was taken out on this home.
Original Mortgage
$40,000
Outstanding Balance
$38,826
Interest Rate
6.5%
Mortgage Type
Mortgage Modification
Estimated Equity
$103,778
Purchase Details
Closed on
May 8, 2015
Sold by
Bruce M Spray Revocable Living Trust
Bought by
Mendrick Gloria
Purchase Details
Closed on
Jun 14, 2010
Bought by
S & M Properties, Llc
Purchase Details
Closed on
Jun 1, 1994
Sold by
Lewis F
Bought by
Mendrick G
Create a Home Valuation Report for This Property
The Home Valuation Report is an in-depth analysis detailing your home's value as well as a comparison with similar homes in the area
Home Values in the Area
Average Home Value in this Area
Purchase History
| Date | Buyer | Sale Price | Title Company |
|---|---|---|---|
| Cash 4 Cars Inc | -- | -- | |
| Mendrick Gloria | -- | None Available | |
| S & M Properties, Llc | -- | -- | |
| Mendrick G | $30,000 | -- |
Source: Public Records
Mortgage History
| Date | Status | Borrower | Loan Amount |
|---|---|---|---|
| Open | Cash 4 Cars Inc | $40,000 |
Source: Public Records
Tax History Compared to Growth
Tax History
| Year | Tax Paid | Tax Assessment Tax Assessment Total Assessment is a certain percentage of the fair market value that is determined by local assessors to be the total taxable value of land and additions on the property. | Land | Improvement |
|---|---|---|---|---|
| 2025 | $1,684 | $62,200 | $0 | $0 |
| 2024 | $1,363 | $52,400 | $0 | $0 |
| 2023 | $1,304 | $45,600 | $0 | $0 |
| 2022 | $1,254 | $30,200 | $0 | $0 |
| 2021 | $1,460 | $26,700 | $26,700 | $0 |
| 2020 | $1,445 | $26,600 | $26,600 | $0 |
| 2019 | $1,411 | $23,800 | $23,800 | $0 |
| 2018 | $1,196 | $23,400 | $0 | $0 |
| 2017 | $1,159 | $23,200 | $0 | $0 |
| 2016 | $1,148 | $24,200 | $0 | $0 |
| 2015 | -- | $22,000 | $0 | $0 |
| 2014 | -- | $21,200 | $0 | $0 |
| 2012 | -- | $21,300 | $0 | $0 |
Source: Public Records
Map
Nearby Homes