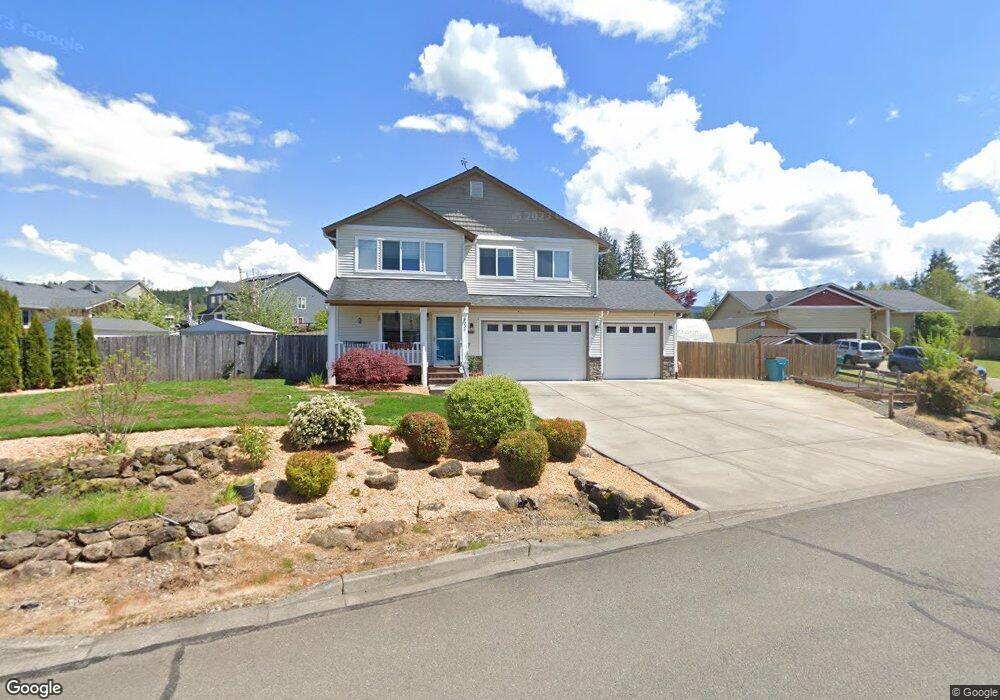
229 S Spruce Ave Yacolt, WA 98675
Estimated Value: $491,000 - $532,729
4
Beds
3
Baths
2,222
Sq Ft
$232/Sq Ft
Est. Value
About This Home
This home is located at 229 S Spruce Ave, Yacolt, WA 98675 and is currently estimated at $515,182, approximately $231 per square foot. 229 S Spruce Ave is a home located in Clark County with nearby schools including Yacolt Primary School, Amboy Middle School, and Battle Ground High School.
Ownership History
Date
Name
Owned For
Owner Type
Purchase Details
Closed on
Aug 21, 2015
Sold by
Bauer Michael T and Bauer Nell L
Bought by
Bryant Mitch H and Bryant Tami L
Current Estimated Value
Home Financials for this Owner
Home Financials are based on the most recent Mortgage that was taken out on this home.
Original Mortgage
$247,000
Outstanding Balance
$194,396
Interest Rate
4.05%
Mortgage Type
New Conventional
Estimated Equity
$320,786
Purchase Details
Closed on
Sep 30, 2008
Sold by
Bauer Nell
Bought by
Bauer Michael T
Home Financials for this Owner
Home Financials are based on the most recent Mortgage that was taken out on this home.
Original Mortgage
$238,017
Interest Rate
6.43%
Mortgage Type
FHA
Create a Home Valuation Report for This Property
The Home Valuation Report is an in-depth analysis detailing your home's value as well as a comparison with similar homes in the area
Home Values in the Area
Average Home Value in this Area
Purchase History
| Date | Buyer | Sale Price | Title Company |
|---|---|---|---|
| Bryant Mitch H | $223,483 | Stewart Title Vancouver | |
| Bauer Michael T | -- | Columbia Title Agency | |
| Bauer Michael T | $212,738 | Columbia Title Agency |
Source: Public Records
Mortgage History
| Date | Status | Borrower | Loan Amount |
|---|---|---|---|
| Open | Bryant Mitch H | $247,000 | |
| Previous Owner | Bauer Michael T | $238,017 |
Source: Public Records
Tax History Compared to Growth
Tax History
| Year | Tax Paid | Tax Assessment Tax Assessment Total Assessment is a certain percentage of the fair market value that is determined by local assessors to be the total taxable value of land and additions on the property. | Land | Improvement |
|---|---|---|---|---|
| 2025 | $4,855 | $492,681 | $130,000 | $362,681 |
| 2024 | $3,627 | $505,094 | $130,000 | $375,094 |
| 2023 | $3,670 | $479,791 | $100,200 | $379,591 |
| 2022 | $3,935 | $447,465 | $92,400 | $355,065 |
| 2021 | $3,672 | $373,371 | $78,000 | $295,371 |
| 2020 | $3,414 | $355,662 | $73,800 | $281,862 |
| 2019 | $2,892 | $320,508 | $69,000 | $251,508 |
| 2018 | $3,719 | $309,065 | $0 | $0 |
| 2017 | $2,901 | $286,696 | $0 | $0 |
| 2016 | $2,841 | $261,031 | $0 | $0 |
| 2015 | $3,090 | $235,946 | $0 | $0 |
| 2014 | -- | $222,427 | $0 | $0 |
| 2013 | -- | $195,851 | $0 | $0 |
Source: Public Records
Map
Nearby Homes
- 410 E Heather Way
- 404 E Valley St
- 307 E Wilson St
- 405 E Oak St
- 508 E Jones St
- 300 E Jones St
- 0 E Yacolt Rd
- 410 E Yacolt Rd
- 102 W Humphrey St
- 405 E Twin Falls St
- 205 E Yacolt Rd
- 106 W Jones St
- 0 NE Thompson Rd Unit 161417797
- 219 W Christy Ct
- 505 W Humphrey St
- 130 N Johnson Ave
- 23706 NE W H Garner Rd
- 27602 NE 3 Creek Rd
- 27915 NE Thompson Cir
- 25815 NE Lucia Falls Rd
- 519 E Timber Way
- 517 E Timber Way
- 325 S Spruce Ave
- 0 S Spruce Ave
- 326 S Spruce Ave
- 327 S Spruce Ave
- 521 E Timber Way
- 230 S Spruce Ave
- 228 S Spruce Ave
- 330 S Spruce Ave
- 329 S Spruce Ave
- 221 S Spruce Ave
- 520 E Timber Way
- 502 E Wilson St
- 226 S Spruce Ave
- 518 E Timber Way
- 502 E Hoag St
- 224 S Spruce Ave
- 405 S Spruce Ave
- 406 S Spruce Ave