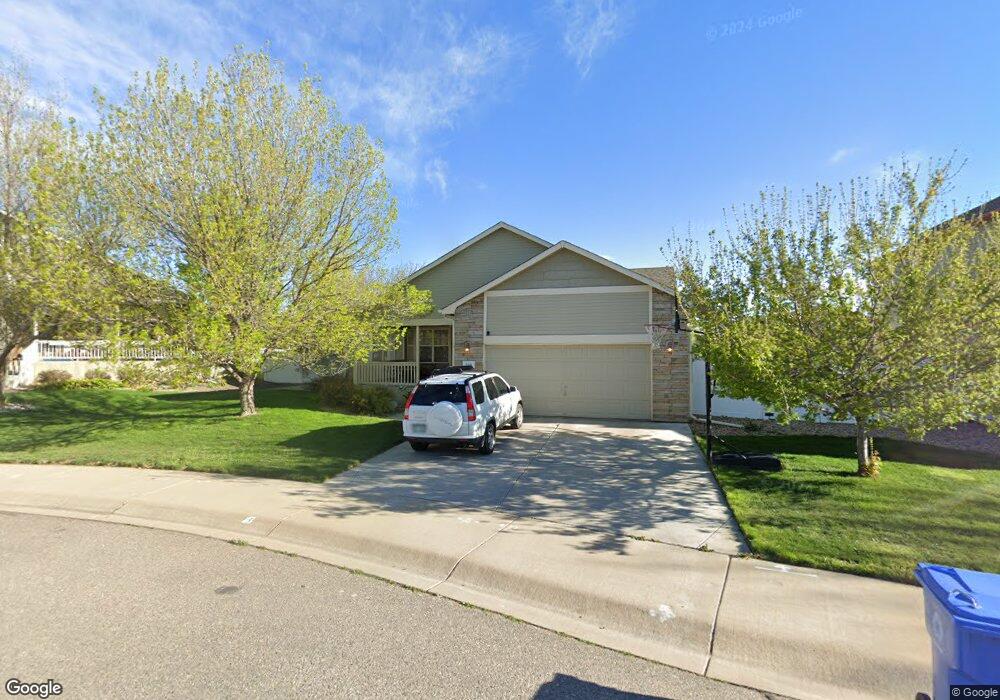
229 Sand Grouse Dr Loveland, CO 80537
Estimated Value: $497,964 - $573,000
3
Beds
2
Baths
1,557
Sq Ft
$343/Sq Ft
Est. Value
About This Home
This home is located at 229 Sand Grouse Dr, Loveland, CO 80537 and is currently estimated at $533,991, approximately $342 per square foot. 229 Sand Grouse Dr is a home located in Larimer County with nearby schools including Winona Elementary School, Peakview Academy at Conrad Ball, and Mountain View High School.
Ownership History
Date
Name
Owned For
Owner Type
Purchase Details
Closed on
Aug 13, 2007
Sold by
Lasalle Bank Na
Bought by
Hennings Karen and Hennings Ryan
Current Estimated Value
Home Financials for this Owner
Home Financials are based on the most recent Mortgage that was taken out on this home.
Original Mortgage
$170,000
Outstanding Balance
$107,855
Interest Rate
6.7%
Mortgage Type
New Conventional
Estimated Equity
$426,136
Purchase Details
Closed on
Jun 6, 2007
Sold by
Ryterski David and Brandon Kelly
Bought by
Lasalle Bank Na
Purchase Details
Closed on
May 31, 2005
Sold by
Journey Homes Llc
Bought by
Ryterski David and Brandon Kelly
Home Financials for this Owner
Home Financials are based on the most recent Mortgage that was taken out on this home.
Original Mortgage
$45,465
Interest Rate
5.39%
Mortgage Type
Stand Alone Second
Create a Home Valuation Report for This Property
The Home Valuation Report is an in-depth analysis detailing your home's value as well as a comparison with similar homes in the area
Home Values in the Area
Average Home Value in this Area
Purchase History
| Date | Buyer | Sale Price | Title Company |
|---|---|---|---|
| Hennings Karen | $212,500 | None Available | |
| Lasalle Bank Na | -- | None Available | |
| Ryterski David | $227,325 | -- |
Source: Public Records
Mortgage History
| Date | Status | Borrower | Loan Amount |
|---|---|---|---|
| Open | Hennings Karen | $170,000 | |
| Previous Owner | Ryterski David | $45,465 | |
| Previous Owner | Ryterski David | $181,860 |
Source: Public Records
Tax History Compared to Growth
Tax History
| Year | Tax Paid | Tax Assessment Tax Assessment Total Assessment is a certain percentage of the fair market value that is determined by local assessors to be the total taxable value of land and additions on the property. | Land | Improvement |
|---|---|---|---|---|
| 2025 | $2,688 | $37,366 | $8,710 | $28,656 |
| 2024 | $2,592 | $37,366 | $8,710 | $28,656 |
| 2022 | $2,334 | $29,329 | $3,642 | $25,687 |
| 2021 | $2,398 | $30,173 | $3,747 | $26,426 |
| 2020 | $2,237 | $28,136 | $3,747 | $24,389 |
| 2019 | $2,199 | $28,136 | $3,747 | $24,389 |
| 2018 | $1,991 | $24,192 | $3,773 | $20,419 |
| 2017 | $1,715 | $24,192 | $3,773 | $20,419 |
| 2016 | $1,604 | $21,866 | $4,171 | $17,695 |
| 2015 | $1,479 | $20,340 | $4,170 | $16,170 |
| 2014 | $1,251 | $16,640 | $4,170 | $12,470 |
Source: Public Records
Map
Nearby Homes
- 432 Cardinal Ave
- 445 Wrybill Ct
- 1523 Peacock Place
- 1465 Peacock Place
- 393 Lavastone Ave
- 2306 E 1st St
- 398 Blue Azurite Ave
- 1510 E 1st St
- 162 Farm Museum Ln
- 1502 E 5th St
- 332 Madison Ave
- 734 Blue Azurite Ave
- 770 Lavastone Ave
- 1238 Finch St
- 1208 Raven Place
- 1270 Inca Dove Cir
- 1343 E 7th St Unit 1
- 255 Carina Cir Unit 105
- 1335 E 7th St
- 374 Krypton Ct
- 221 Sand Grouse Dr
- 237 Sand Grouse Dr
- 213 Sand Grouse Dr
- 1828 E 1st St
- 245 Sand Grouse Dr
- 254 Sand Grouse Dr
- 244 Sand Grouse Dr
- 253 Sand Grouse Dr
- 234 Sand Grouse Dr
- 205 Sand Grouse Dr
- 312 Lark Bunting Ave
- 328 Lark Bunting Ave
- 344 Lark Bunting Ave
- 261 Sand Grouse Dr
- 296 Lark Bunting Ave
- 215 Snow Goose Ave
- 360 Lark Bunting Ave
- 224 Sand Grouse Dr
- 280 Lark Bunting Ave
- 203 Snow Goose Ave