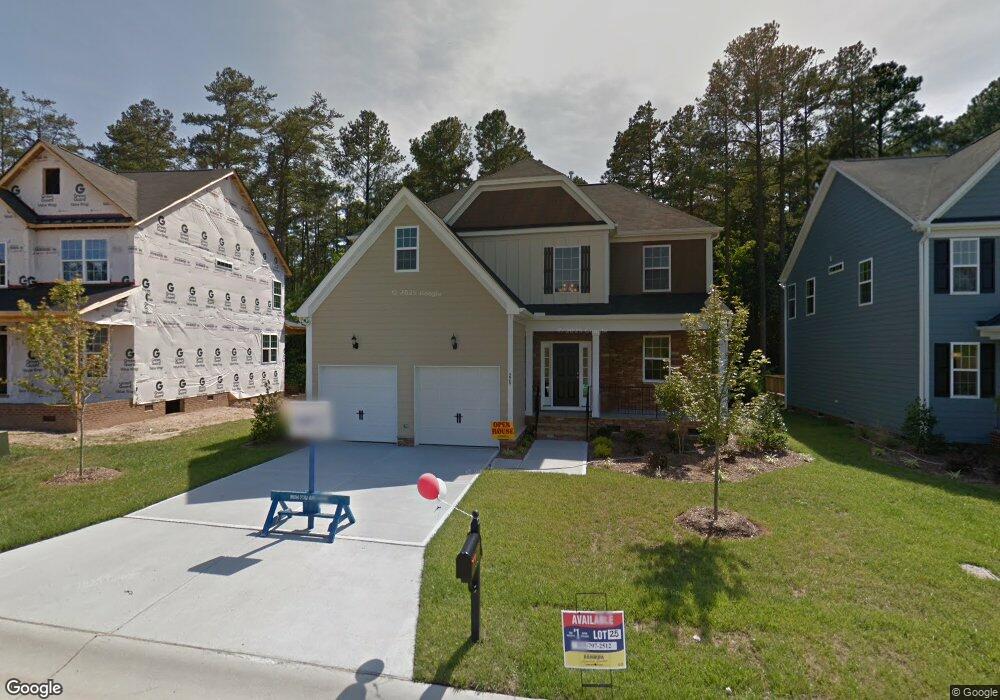
229 Strolling Way Durham, NC 27707
Patterson Place NeighborhoodEstimated Value: $573,191 - $609,000
4
Beds
3
Baths
2,457
Sq Ft
$240/Sq Ft
Est. Value
About This Home
This home is located at 229 Strolling Way, Durham, NC 27707 and is currently estimated at $589,798, approximately $240 per square foot. 229 Strolling Way is a home located in Durham County with nearby schools including Morehead Montessori, Sherwood Githens Middle, and Jordan High School.
Ownership History
Date
Name
Owned For
Owner Type
Purchase Details
Closed on
Dec 6, 2024
Sold by
Price Norman Philip and Frederick Helyne
Bought by
Norman Philip Price And Helyne Frederick Livi and Price
Current Estimated Value
Purchase Details
Closed on
Oct 11, 2017
Sold by
Sharp Kevin T and Sharp Julia A
Bought by
Price Norman and Frederick Helyne
Home Financials for this Owner
Home Financials are based on the most recent Mortgage that was taken out on this home.
Original Mortgage
$253,600
Interest Rate
3.82%
Mortgage Type
New Conventional
Purchase Details
Closed on
Feb 19, 2013
Sold by
D R Horton Inc
Bought by
Sharp Kevin T and Sharp Julia A
Home Financials for this Owner
Home Financials are based on the most recent Mortgage that was taken out on this home.
Original Mortgage
$250,593
Interest Rate
3.35%
Mortgage Type
VA
Create a Home Valuation Report for This Property
The Home Valuation Report is an in-depth analysis detailing your home's value as well as a comparison with similar homes in the area
Home Values in the Area
Average Home Value in this Area
Purchase History
| Date | Buyer | Sale Price | Title Company |
|---|---|---|---|
| Norman Philip Price And Helyne Frederick Livi | -- | None Listed On Document | |
| Norman Philip Price And Helyne Frederick Livi | -- | None Listed On Document | |
| Price Norman | $317,000 | None Available | |
| Sharp Kevin T | -- | None Available |
Source: Public Records
Mortgage History
| Date | Status | Borrower | Loan Amount |
|---|---|---|---|
| Previous Owner | Price Norman | $253,600 | |
| Previous Owner | Sharp Kevin T | $250,593 |
Source: Public Records
Tax History
| Year | Tax Paid | Tax Assessment Tax Assessment Total Assessment is a certain percentage of the fair market value that is determined by local assessors to be the total taxable value of land and additions on the property. | Land | Improvement |
|---|---|---|---|---|
| 2025 | $5,673 | $572,254 | $145,000 | $427,254 |
| 2024 | $4,692 | $336,395 | $78,367 | $258,028 |
| 2023 | $4,406 | $336,395 | $78,367 | $258,028 |
| 2022 | $4,306 | $336,395 | $78,367 | $258,028 |
| 2021 | $4,285 | $336,395 | $78,367 | $258,028 |
| 2020 | $4,184 | $336,395 | $78,367 | $258,028 |
| 2019 | $4,184 | $336,395 | $78,367 | $258,028 |
| 2018 | $4,190 | $308,906 | $58,050 | $250,856 |
| 2017 | $4,159 | $308,906 | $58,050 | $250,856 |
| 2016 | $4,019 | $308,906 | $58,050 | $250,856 |
| 2015 | $4,301 | $310,688 | $58,183 | $252,505 |
| 2014 | $4,301 | $310,688 | $58,183 | $252,505 |
Source: Public Records
Map
Nearby Homes
- 3930 Kelly Dr
- 103 Ashworth Dr
- 5406 Garrett Rd
- 3906 Sterling Ridge Ln
- 3903 Kelly Dr
- 13 Morgans Ridge Ln
- 18 Scottish Ln
- 4816 Marvin Dr
- 4125 Farrington Rd
- 4515 Chicopee Trail
- 4916 Pine Cone Dr
- 4101 Five Oaks Dr Unit 19
- 38 Innisfree Dr
- 4100 Five Oaks Dr Unit 50
- 4100 Five Oaks Dr Unit 37
- 3946 Nottaway Rd
- 4014 Nottaway Rd
- 5013 Pine Cone Dr
- 5008 Butternut Rd
- 3932 Old Chapel Hill Rd
- 231 Strolling Way
- 227 Strolling Way
- 233 Strolling Way
- 225 Strolling Way
- 228 Strolling Way
- 226 Strolling Way
- 230 Strolling Way
- 235 Strolling Way
- 232 Strolling Way
- 223 Strolling Way
- 222 Strolling Way
- 236 Strolling Way
- 237 Strolling Way
- 11 Hidden Ridge Ct
- 220 Strolling Way
- 9 Hidden Ridge Ct
- 15 Hidden Ridge Ct
- 219 Strolling Way
- 7 Hidden Ridge Ct
- 13 Hidden Ridge Ct
Your Personal Tour Guide
Ask me questions while you tour the home.