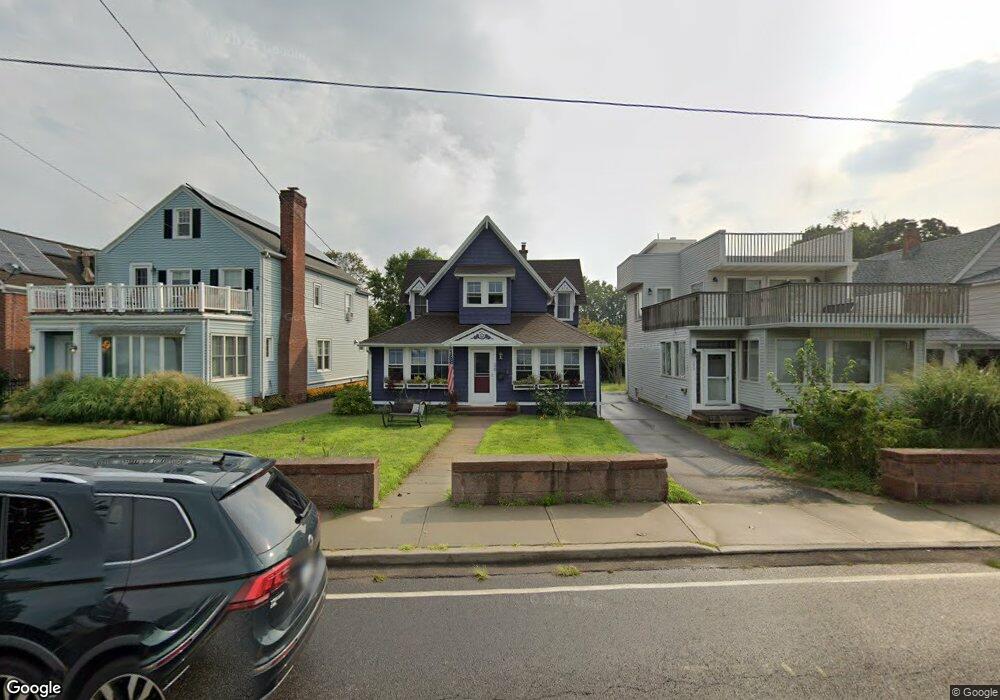
229 Townsend Ave New Haven, CT 06512
East Shore NeighborhoodEstimated Value: $448,494 - $539,000
4
Beds
2
Baths
1,522
Sq Ft
$326/Sq Ft
Est. Value
About This Home
This home is located at 229 Townsend Ave, New Haven, CT 06512 and is currently estimated at $496,624, approximately $326 per square foot. 229 Townsend Ave is a home located in New Haven County with nearby schools including Nathan Hale School, Cold Spring School, and Pathway School.
Ownership History
Date
Name
Owned For
Owner Type
Purchase Details
Closed on
Feb 21, 2023
Sold by
Virtue Lynn
Bought by
Virtue Brian
Current Estimated Value
Home Financials for this Owner
Home Financials are based on the most recent Mortgage that was taken out on this home.
Original Mortgage
$347,500
Outstanding Balance
$336,197
Interest Rate
6.13%
Mortgage Type
Stand Alone Refi Refinance Of Original Loan
Estimated Equity
$160,427
Purchase Details
Closed on
Jun 20, 2003
Sold by
Visschio Andrew
Bought by
Virtue Brian and Virtue Lynn
Home Financials for this Owner
Home Financials are based on the most recent Mortgage that was taken out on this home.
Original Mortgage
$174,000
Interest Rate
5.71%
Create a Home Valuation Report for This Property
The Home Valuation Report is an in-depth analysis detailing your home's value as well as a comparison with similar homes in the area
Home Values in the Area
Average Home Value in this Area
Purchase History
| Date | Buyer | Sale Price | Title Company |
|---|---|---|---|
| Virtue Brian | -- | None Available | |
| Virtue Brian | -- | None Available | |
| Virtue Brian | $217,500 | -- | |
| Virtue Brian | $217,500 | -- |
Source: Public Records
Mortgage History
| Date | Status | Borrower | Loan Amount |
|---|---|---|---|
| Open | Virtue Brian | $347,500 | |
| Closed | Virtue Brian | $347,500 | |
| Previous Owner | Virtue Brian | $312,594 | |
| Previous Owner | Virtue Brian | $344,423 | |
| Previous Owner | Virtue Brian | $277,500 | |
| Previous Owner | Virtue Brian | $174,000 |
Source: Public Records
Tax History
| Year | Tax Paid | Tax Assessment Tax Assessment Total Assessment is a certain percentage of the fair market value that is determined by local assessors to be the total taxable value of land and additions on the property. | Land | Improvement |
|---|---|---|---|---|
| 2025 | $9,548 | $242,340 | $110,740 | $131,600 |
| 2024 | $9,330 | $242,340 | $110,740 | $131,600 |
| 2023 | $9,015 | $242,340 | $110,740 | $131,600 |
| 2022 | $9,633 | $242,340 | $110,740 | $131,600 |
| 2021 | $8,991 | $204,890 | $102,410 | $102,480 |
| 2020 | $8,991 | $204,890 | $102,410 | $102,480 |
| 2019 | $8,806 | $204,890 | $102,410 | $102,480 |
| 2018 | $8,806 | $204,890 | $102,410 | $102,480 |
| 2017 | $7,925 | $204,890 | $102,410 | $102,480 |
| 2016 | $8,260 | $198,800 | $100,170 | $98,630 |
| 2015 | $8,260 | $198,800 | $100,170 | $98,630 |
| 2014 | $8,260 | $198,800 | $100,170 | $98,630 |
Source: Public Records
Map
Nearby Homes
- 257 Concord St
- 26 Nelson St
- 15 Arden St
- 327 Concord St
- 388 Concord St
- 24 Woodward Ave Unit 46
- 120 Stuyvesant Ave
- 52 Stuyvesant Ave
- 506 Lighthouse Rd
- 145 Fort Hale Rd
- 119 Cove St
- 86 Cove St
- 19 Rhea St
- 366 Burr St
- 59 Clifford Terrace
- 56 Victor St
- 675 Townsend Ave Unit 157
- 48 Morris Ave
- 44 Meadow View Rd
- 745 Townsend Ave Unit Lot 1
- 225 Townsend Ave
- 223 Townsend Ave
- 223 Townsend Ave Unit 1
- 223 Townsend Ave Unit 2
- 239 Townsend Ave
- 221 Townsend Ave
- 219 Townsend Ave
- 241 Townsend Ave
- 19 Florence Ave
- 25 Florence Ave
- 215 Townsend Ave
- 245 Townsend Ave
- 247 Townsend Ave
- 35 Florence Ave
- 249 Townsend Ave
- 211 Townsend Ave
- 30 Mansion St
- 28 Mansion St
- 37 Florence Ave
- 24 Parker Place
Your Personal Tour Guide
Ask me questions while you tour the home.