Estimated Value: $433,520 - $471,000
3
Beds
2
Baths
1,410
Sq Ft
$322/Sq Ft
Est. Value
About This Home
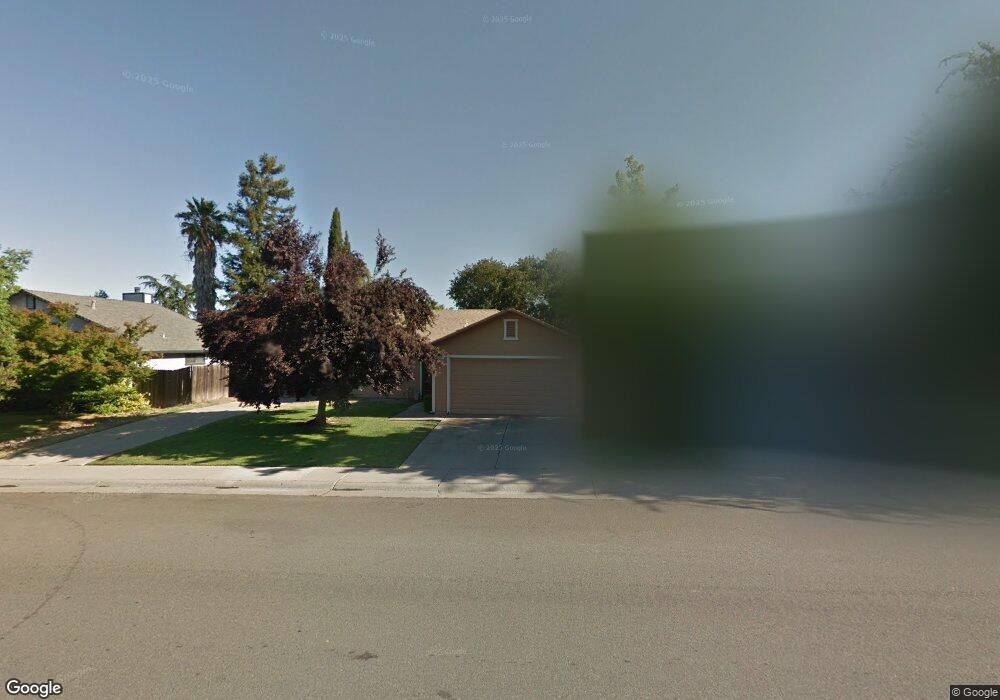
This home is located at 229 W E St, Galt, CA 95632 and is currently estimated at $454,380, approximately $322 per square foot. 229 W E St is a home located in Sacramento County with nearby schools including Valley Oaks Elementary School, Robert L. McCaffrey Middle School, and Galt High School.
Ownership History
Date
Name
Owned For
Owner Type
Purchase Details
Closed on
Nov 22, 1999
Sold by
Trust Edwin L & Edith M Maurer Revocable and Maurer Edith M
Bought by
Perez Pete E and Perez Darla R
Current Estimated Value
Home Financials for this Owner
Home Financials are based on the most recent Mortgage that was taken out on this home.
Original Mortgage
$128,119
Outstanding Balance
$39,383
Interest Rate
7.84%
Mortgage Type
FHA
Estimated Equity
$414,997
Create a Home Valuation Report for This Property
The Home Valuation Report is an in-depth analysis detailing your home's value as well as a comparison with similar homes in the area
Home Values in the Area
Average Home Value in this Area
Purchase History
| Date | Buyer | Sale Price | Title Company |
|---|---|---|---|
| Perez Pete E | $129,000 | Sacramento Title Company |
Source: Public Records
Mortgage History
| Date | Status | Borrower | Loan Amount |
|---|---|---|---|
| Open | Perez Pete E | $128,119 |
Source: Public Records
Tax History
| Year | Tax Paid | Tax Assessment Tax Assessment Total Assessment is a certain percentage of the fair market value that is determined by local assessors to be the total taxable value of land and additions on the property. | Land | Improvement |
|---|---|---|---|---|
| 2025 | $2,103 | $198,249 | $38,413 | $159,836 |
| 2024 | $2,103 | $194,362 | $37,660 | $156,702 |
| 2023 | $2,066 | $190,552 | $36,922 | $153,630 |
| 2022 | $1,981 | $186,817 | $36,199 | $150,618 |
| 2021 | $1,982 | $183,155 | $35,490 | $147,665 |
| 2020 | $1,965 | $181,278 | $35,127 | $146,151 |
| 2019 | $1,915 | $177,725 | $34,439 | $143,286 |
| 2018 | $1,910 | $174,241 | $33,764 | $140,477 |
| 2017 | $1,834 | $170,825 | $33,102 | $137,723 |
| 2016 | $1,760 | $167,476 | $32,453 | $135,023 |
| 2015 | $1,699 | $164,961 | $31,966 | $132,995 |
| 2014 | $1,693 | $161,730 | $31,340 | $130,390 |
Source: Public Records
Map
Nearby Homes
Your Personal Tour Guide
Ask me questions while you tour the home.