Estimated Value: $146,910 - $202,000
3
Beds
1
Bath
1,118
Sq Ft
$148/Sq Ft
Est. Value
About This Home
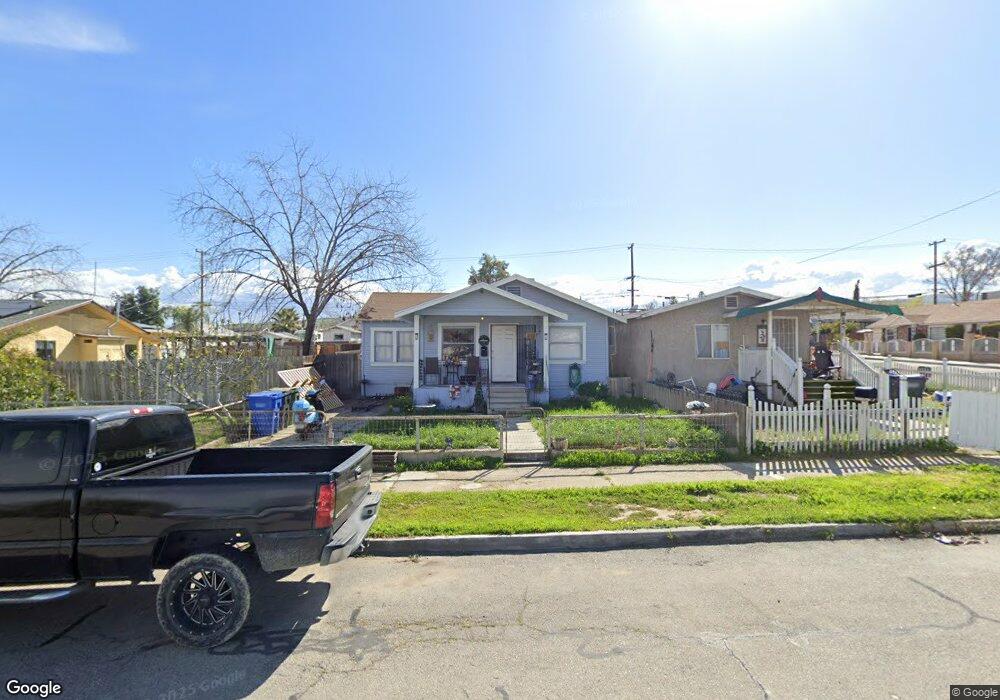
This home is located at 229 Warren St, Taft, CA 93268 and is currently estimated at $165,478, approximately $148 per square foot. 229 Warren St is a home located in Kern County with nearby schools including Taft Primary School, Roosevelt Elementary School, and Lincoln Junior High School.
Ownership History
Date
Name
Owned For
Owner Type
Purchase Details
Closed on
Apr 21, 2025
Sold by
Barnes Coy and Barnes Sarah
Bought by
Golden Hour Trust and Barnes
Current Estimated Value
Purchase Details
Closed on
Oct 30, 2017
Sold by
Anderson Jason
Bought by
Barnes Coy and Barnes Sarah
Purchase Details
Closed on
Jun 30, 2017
Sold by
Caballero Sheryl and The Cox Family Trust
Bought by
Anderson Jason
Purchase Details
Closed on
Sep 24, 2001
Sold by
Cox Virgie C
Bought by
Cox Virgie C and Dale Cox Curtis
Create a Home Valuation Report for This Property
The Home Valuation Report is an in-depth analysis detailing your home's value as well as a comparison with similar homes in the area
Home Values in the Area
Average Home Value in this Area
Purchase History
| Date | Buyer | Sale Price | Title Company |
|---|---|---|---|
| Golden Hour Trust | -- | None Listed On Document | |
| Barnes Coy | $55,000 | Chicago Title Company | |
| Anderson Jason | -- | None Available | |
| Cox Virgie C | -- | None Available |
Source: Public Records
Tax History
| Year | Tax Paid | Tax Assessment Tax Assessment Total Assessment is a certain percentage of the fair market value that is determined by local assessors to be the total taxable value of land and additions on the property. | Land | Improvement |
|---|---|---|---|---|
| 2025 | $1,988 | $59,161 | $17,065 | $42,096 |
| 2024 | $1,822 | $58,002 | $16,731 | $41,271 |
| 2023 | $1,822 | $56,865 | $16,403 | $40,462 |
| 2022 | $1,693 | $55,751 | $16,082 | $39,669 |
| 2021 | $1,559 | $54,659 | $15,767 | $38,892 |
| 2020 | $1,364 | $54,100 | $15,606 | $38,494 |
| 2019 | $1,353 | $54,100 | $15,606 | $38,494 |
| 2018 | $1,337 | $52,000 | $15,000 | $37,000 |
| 2017 | $889 | $13,538 | $3,954 | $9,584 |
| 2016 | $863 | $13,274 | $3,877 | $9,397 |
| 2015 | $808 | $13,075 | $3,819 | $9,256 |
| 2014 | $757 | $12,820 | $3,745 | $9,075 |
Source: Public Records
Map
Nearby Homes
Your Personal Tour Guide
Ask me questions while you tour the home.