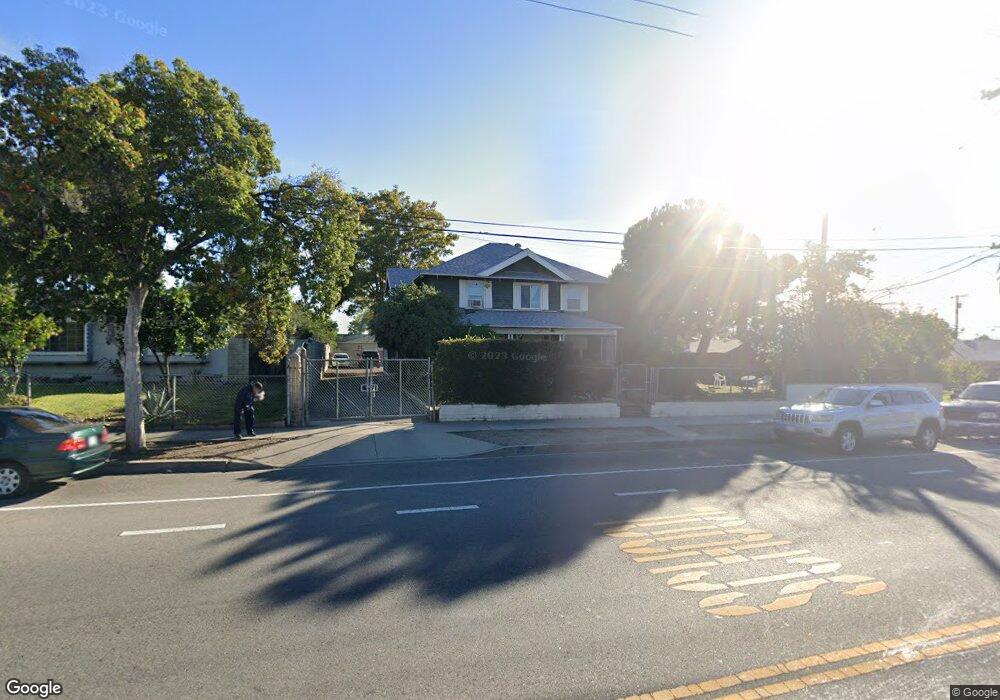
2290 N San Antonio Ave Unit 5 Pomona, CA 91767
Pomona Valley NeighborhoodEstimated Value: $749,253 - $1,300,000
2
Beds
1
Bath
800
Sq Ft
$1,172/Sq Ft
Est. Value
About This Home
This home is located at 2290 N San Antonio Ave Unit 5, Pomona, CA 91767 and is currently estimated at $937,563, approximately $1,171 per square foot. 2290 N San Antonio Ave Unit 5 is a home located in Los Angeles County with nearby schools including Barfield Elementary School, Palomares Academy Of Health Science, and Pomona High School.
Ownership History
Date
Name
Owned For
Owner Type
Purchase Details
Closed on
Nov 17, 2023
Sold by
Cheung Terence Lam
Bought by
Geo700 Llc
Current Estimated Value
Purchase Details
Closed on
May 26, 2023
Sold by
Tsz700 Llc
Bought by
Geo700 Llc
Purchase Details
Closed on
Jun 1, 2015
Sold by
Beach Cities Real Property Holdings Llc
Bought by
Tsz700 Llc
Purchase Details
Closed on
Dec 23, 2014
Sold by
Oake Roberta M and The Sidney Mellon Living Trust
Bought by
Beach Cities Real Property Holdings Llc
Purchase Details
Closed on
Oct 11, 2010
Sold by
Mellon Sidney and Mellon Family Living Trust
Bought by
Mellon Sidney and The Sidney Mellon Living Trust
Purchase Details
Closed on
Sep 30, 1994
Sold by
Oake Robbi and Gorelick Michael
Bought by
Mellon Sidney and Mellon Helen
Create a Home Valuation Report for This Property
The Home Valuation Report is an in-depth analysis detailing your home's value as well as a comparison with similar homes in the area
Home Values in the Area
Average Home Value in this Area
Purchase History
| Date | Buyer | Sale Price | Title Company |
|---|---|---|---|
| Geo700 Llc | -- | Old Republic Title Company | |
| Geo700 Llc | -- | Accommodation/Courtesy Recordi | |
| Tsz700 Llc | $415,000 | Lawyers Title | |
| Beach Cities Real Property Holdings Llc | $50,000 | Lawyers Title | |
| Mellon Sidney | -- | None Available | |
| Mellon Sidney | -- | -- | |
| Mellon Sidney | -- | -- |
Source: Public Records
Tax History Compared to Growth
Tax History
| Year | Tax Paid | Tax Assessment Tax Assessment Total Assessment is a certain percentage of the fair market value that is determined by local assessors to be the total taxable value of land and additions on the property. | Land | Improvement |
|---|---|---|---|---|
| 2025 | $6,872 | $498,758 | $240,367 | $258,391 |
| 2024 | $6,872 | $488,979 | $235,654 | $253,325 |
| 2023 | $6,741 | $479,392 | $231,034 | $248,358 |
| 2022 | $6,631 | $469,993 | $226,504 | $243,489 |
| 2021 | $6,464 | $460,778 | $222,063 | $238,715 |
| 2020 | $6,442 | $456,055 | $219,787 | $236,268 |
| 2019 | $6,588 | $447,114 | $215,478 | $231,636 |
| 2018 | $6,089 | $438,348 | $211,253 | $227,095 |
| 2016 | $5,702 | $421,328 | $203,050 | $218,278 |
| 2015 | $6,658 | $500,000 | $350,000 | $150,000 |
| 2014 | -- | $60,949 | $9,774 | $51,175 |
Source: Public Records
Map
Nearby Homes
- 2270 N Towne Ave Unit 3
- 2401 N Towne Ave
- 2405 Highland Pines Rd
- 2410 N Towne Ave
- 2410 N Towne Ave Unit 63
- 2196 Stocker St
- 2360 Lovejoy St
- 720 Toluca Ave
- 2415 Lovejoy St
- 2440 Merrywood St
- 1064 E La Verne Ave
- 2183 Sinclair St
- 1968 Miramar St
- 732 James Place
- 2497 Logan St
- 370 E La Verne Ave
- 387 Carleton Ave
- 1936 Royalty Dr
- 1924 Royalty Dr
- 1916 Mountain Ave
- 2290 N San Antonio Ave Unit 4
- 2290 N San Antonio Ave Unit 2
- 2290 N San Antonio Ave
- 2268 N San Antonio Ave
- 2246 N San Antonio Ave
- 2259 Larchmont St
- 2267 Larchmont St
- 2238 N San Antonio Ave
- 2243 Larchmont St
- 2235 Larchmont St
- 787 Bangor St
- 815 Collingswood Dr
- 807 Collingswood Dr
- 2229 Larchmont St
- 781 Bangor St
- 838 Collingswood Dr
- 2218 N San Antonio Ave
- 823 Collingswood Dr
- 855 Asbury Ave
- 2289 N San Antonio Ave