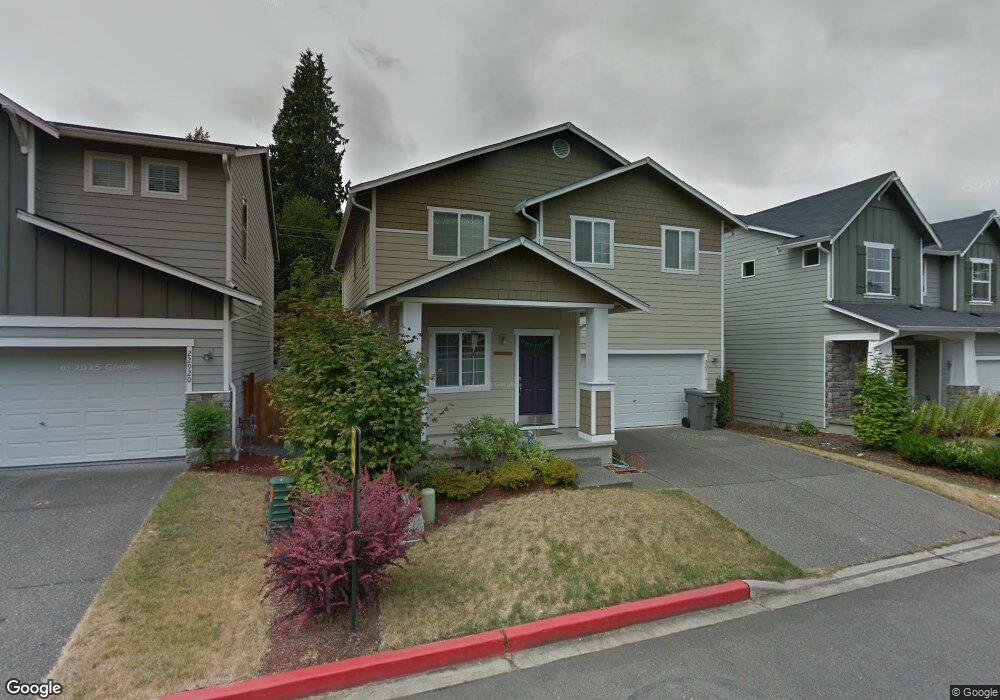
22916 27th Dr SE Unit 3 Bothell, WA 98021
Canyon Creek NeighborhoodEstimated Value: $983,000 - $1,188,000
4
Beds
3
Baths
2,438
Sq Ft
$438/Sq Ft
Est. Value
About This Home
This home is located at 22916 27th Dr SE Unit 3, Bothell, WA 98021 and is currently estimated at $1,066,717, approximately $437 per square foot. 22916 27th Dr SE Unit 3 is a home located in Snohomish County with nearby schools including Maywood Hills Elementary School, Canyon Park Junior High School, and Bothell High School.
Ownership History
Date
Name
Owned For
Owner Type
Purchase Details
Closed on
Oct 8, 2007
Sold by
American International Relocation Soluti
Bought by
Mamundi Rao Sira Panduranga and Mamundi Venugopal Sowmya
Current Estimated Value
Home Financials for this Owner
Home Financials are based on the most recent Mortgage that was taken out on this home.
Original Mortgage
$46,650
Outstanding Balance
$29,412
Interest Rate
6.4%
Mortgage Type
Credit Line Revolving
Estimated Equity
$1,037,305
Purchase Details
Closed on
Feb 10, 2006
Sold by
Centex Homes
Bought by
Neary Michael C and Neary Lisa A
Home Financials for this Owner
Home Financials are based on the most recent Mortgage that was taken out on this home.
Original Mortgage
$357,750
Interest Rate
6.2%
Mortgage Type
Fannie Mae Freddie Mac
Create a Home Valuation Report for This Property
The Home Valuation Report is an in-depth analysis detailing your home's value as well as a comparison with similar homes in the area
Home Values in the Area
Average Home Value in this Area
Purchase History
| Date | Buyer | Sale Price | Title Company |
|---|---|---|---|
| Mamundi Rao Sira Panduranga | $467,000 | First American | |
| American International Relocation Soluti | $467,000 | First American | |
| Neary Michael C | $447,223 | Pnwt |
Source: Public Records
Mortgage History
| Date | Status | Borrower | Loan Amount |
|---|---|---|---|
| Open | American International Relocation Soluti | $46,650 | |
| Open | American International Relocation Soluti | $373,600 | |
| Closed | Mamundi Rao Sira Panduranga | $373,600 | |
| Previous Owner | Neary Michael C | $357,750 |
Source: Public Records
Tax History Compared to Growth
Tax History
| Year | Tax Paid | Tax Assessment Tax Assessment Total Assessment is a certain percentage of the fair market value that is determined by local assessors to be the total taxable value of land and additions on the property. | Land | Improvement |
|---|---|---|---|---|
| 2025 | $7,001 | $892,600 | $552,900 | $339,700 |
| 2024 | $7,001 | $820,200 | $499,600 | $320,600 |
| 2023 | $7,956 | $1,027,400 | $608,200 | $419,200 |
| 2022 | $6,707 | $696,300 | $340,500 | $355,800 |
| 2020 | $6,432 | $619,300 | $313,500 | $305,800 |
| 2019 | $5,802 | $578,400 | $275,500 | $302,900 |
| 2018 | $5,324 | $510,800 | $237,500 | $273,300 |
| 2017 | $4,463 | $431,300 | $175,800 | $255,500 |
| 2016 | $4,354 | $436,200 | $159,600 | $276,600 |
| 2015 | $4,247 | $403,500 | $137,800 | $265,700 |
| 2013 | $3,403 | $292,200 | $110,000 | $182,200 |
Source: Public Records
Map
Nearby Homes
- 23214 27th Ave SE Unit 2
- 23210 27th Ave SE Unit 2
- 23210 27th Ave SE Unit 1
- 3333 228th St SE Unit 69
- 3333 228th St SE Unit 74
- 3333 228th St SE Unit 100
- 23122 35th Ave SE
- 23724 35th Dr SE Unit 44
- 23736 35th Dr SE Unit 42
- 3520 237th St SE Unit 45
- 23731 35th Dr SE Unit 38
- 3605 231st Place SE
- 23426 35th Ave SE
- 3611 232nd St SE
- 22428 19th Ave SE
- 22617 36th Dr SE
- 23127 36th Dr SE
- 3509 237th St SE Unit 27
- 3508 237th St SE Unit 47
- 23605 35th Dr SE Unit 30
- 22920 27th Dr SE Unit 4
- 22912 27th Dr SE Unit 2
- 22924 27th Dr SE Unit 5
- 22908 27th Dr SE Unit 1
- 22915 27th Dr SE Unit 69
- 22911 27th Dr SE Unit 70
- 22928 27th Dr SE Unit 6
- 22907 27th Dr SE Unit 71
- 22932 27th Dr SE
- 22903 27th Dr SE Unit 72
- 22934 27th Dr SE Unit 8
- 22933 27th Dr SE
- 23004 27th Dr SE
- 23001 27th Dr SE Unit 67
- 23008 27th Dr SE Unit 10
- 23005 27th Dr SE Unit 66
- 2714 228th St SE
- 23012 27th Dr SE Unit 11
- 23009 27th Dr SE Unit 65
- 23016 27th Dr SE Unit 12