


Last list price
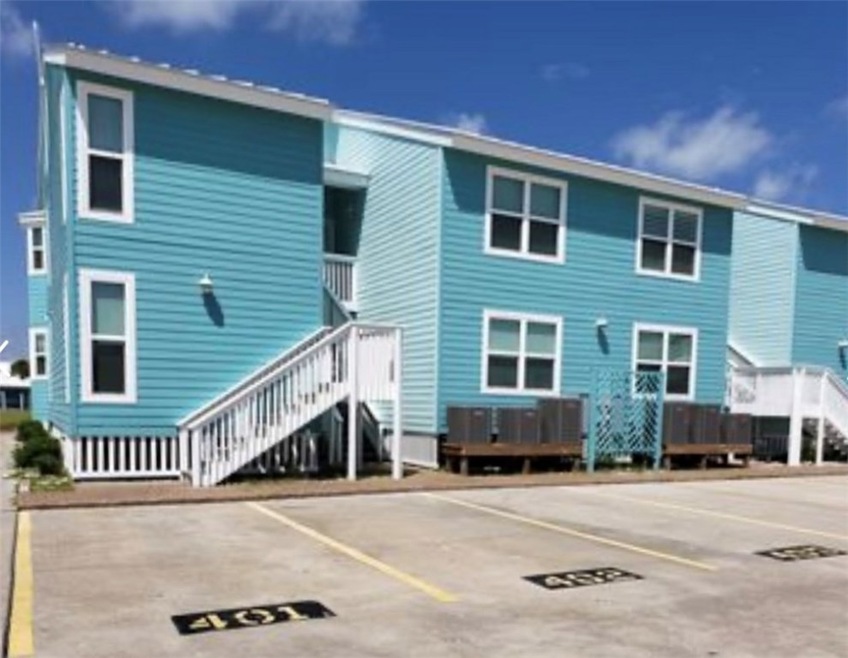
2292 N Fulton Beach Rd Rockport, TX 78382
1
Bed
1
Bath
791
Sq Ft
$618/mo
HOA Fee
Highlights
- Boat Dock
- In Ground Pool
- Gated Community
- Boat Ramp
- Automatic Gate
- Waterfront
About This Home
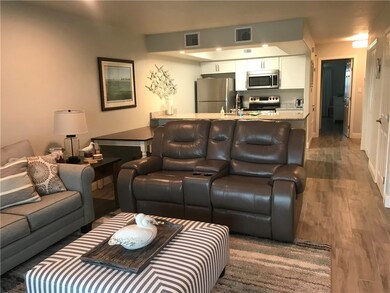
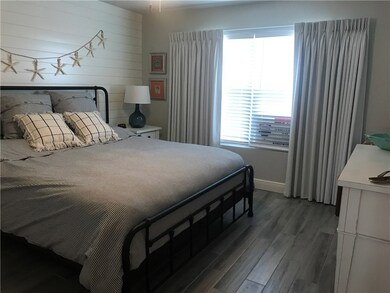
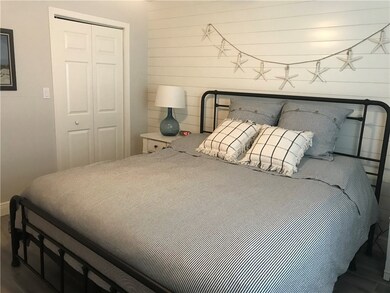
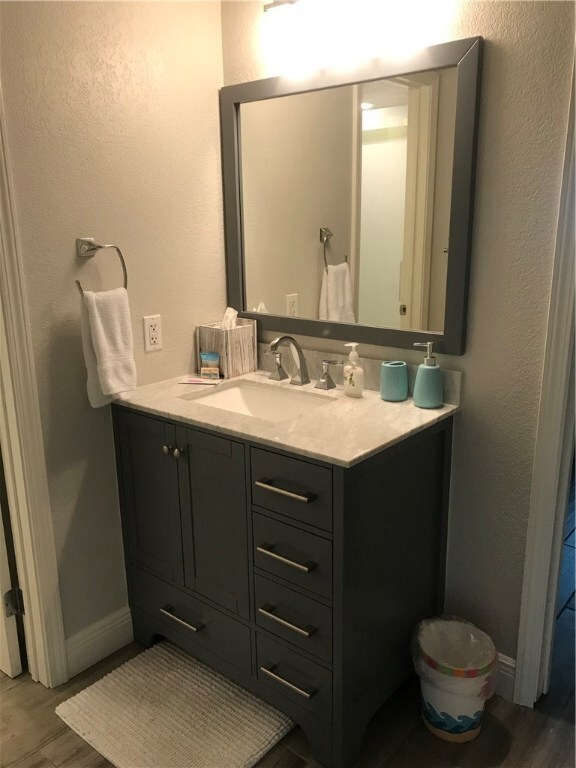
As of July 2025Beautifully renovated waterfront condo. Nice size 1/1 downstairs with a open concept living space and lots of upgrades. Boat dock & slip directly off the back patio. Being sold fully furnished. Excellent rental potential. Konitia Beach Condos have their own beach area, lighted fishing pier, boat launch, pool, and tennis courts. HOA fee covers water, sewer, trash, cable, building insurance, common ground maintenance, and a short term special assessment for new pilings.
Last Agent to Sell the Property
RE/MAX Security Real Estate License #0646329 Listed on: 03/04/2020
Last Buyer's Agent
Non MLS
NONMLS (NonMLS)
Property Details
Home Type
- Condominium
Est. Annual Taxes
- $47
Year Built
- Built in 1984
Lot Details
- Waterfront
- Private Entrance
HOA Fees
- $618 Monthly HOA Fees
Home Design
- Pillar, Post or Pier Foundation
- Metal Roof
- HardiePlank Type
Interior Spaces
- 791 Sq Ft Home
- 1-Story Property
- Ceiling Fan
- Window Treatments
- Tile Flooring
- Water Views
Kitchen
- Breakfast Bar
- Electric Oven or Range
- Microwave
- Dishwasher
Bedrooms and Bathrooms
- 1 Bedroom
- 1 Full Bathroom
Laundry
- Laundry closet
- Dryer
- Washer
Parking
- 1 Parking Space
- Automatic Gate
- Assigned Parking
Eco-Friendly Details
- Energy-Efficient Doors
Outdoor Features
- In Ground Pool
- Boat Ramp
- Docks
- Deck
- Covered patio or porch
Schools
- Rockport Elementary And Middle School
- Rockport High School
Utilities
- Central Heating and Cooling System
- Cable TV Available
Listing and Financial Details
- Short Term Rentals Allowed
Community Details
Overview
- Association fees include boat ramp, common areas, cable TV, insurance, ground maintenance, maintenance structure, trash, water
- Kontiki Beach Condo Subdivision
Recreation
- Boat Dock
- Tennis Courts
Security
- Gated Community
Similar Homes in Rockport, TX
Create a Home Valuation Report for This Property
The Home Valuation Report is an in-depth analysis detailing your home's value as well as a comparison with similar homes in the area
Home Values in the Area
Average Home Value in this Area
Property History
| Date | Event | Price | Change | Sq Ft Price |
|---|---|---|---|---|
| 07/14/2025 07/14/25 | Price Changed | $375,000 | 0.0% | $304 / Sq Ft |
| 07/11/2025 07/11/25 | Sold | -- | -- | -- |
| 06/18/2025 06/18/25 | For Sale | $375,000 | -3.8% | $265 / Sq Ft |
| 05/29/2025 05/29/25 | Pending | -- | -- | -- |
| 05/19/2025 05/19/25 | For Sale | $389,900 | +52.9% | $316 / Sq Ft |
| 05/06/2025 05/06/25 | For Sale | $255,000 | -30.9% | $322 / Sq Ft |
| 02/11/2025 02/11/25 | For Sale | $369,000 | -15.2% | $466 / Sq Ft |
| 07/26/2024 07/26/24 | Sold | -- | -- | -- |
| 06/14/2024 06/14/24 | For Sale | $434,900 | +46.4% | $308 / Sq Ft |
| 01/01/2024 01/01/24 | Pending | -- | -- | -- |
| 11/05/2023 11/05/23 | Off Market | -- | -- | -- |
| 10/20/2023 10/20/23 | Sold | -- | -- | -- |
| 09/28/2023 09/28/23 | For Sale | $297,000 | -42.3% | $375 / Sq Ft |
| 08/29/2023 08/29/23 | Off Market | -- | -- | -- |
| 08/28/2023 08/28/23 | Sold | -- | -- | -- |
| 08/28/2023 08/28/23 | Sold | -- | -- | -- |
| 08/27/2023 08/27/23 | Pending | -- | -- | -- |
| 07/25/2023 07/25/23 | For Sale | $515,000 | 0.0% | $418 / Sq Ft |
| 07/25/2023 07/25/23 | For Sale | $515,000 | +47.1% | $418 / Sq Ft |
| 04/12/2023 04/12/23 | Sold | -- | -- | -- |
| 01/01/2023 01/01/23 | Pending | -- | -- | -- |
| 01/01/2023 01/01/23 | Pending | -- | -- | -- |
| 12/23/2022 12/23/22 | For Sale | $350,000 | -4.1% | $184 / Sq Ft |
| 01/10/2022 01/10/22 | Sold | -- | -- | -- |
| 04/26/2021 04/26/21 | Sold | -- | -- | -- |
| 03/27/2021 03/27/21 | Pending | -- | -- | -- |
| 03/22/2021 03/22/21 | For Sale | $365,000 | +102.8% | $258 / Sq Ft |
| 01/01/2021 01/01/21 | Pending | -- | -- | -- |
| 09/30/2020 09/30/20 | Sold | -- | -- | -- |
| 09/30/2020 09/30/20 | Sold | -- | -- | -- |
| 08/31/2020 08/31/20 | Pending | -- | -- | -- |
| 04/21/2020 04/21/20 | For Sale | $180,000 | -24.1% | $228 / Sq Ft |
| 04/08/2020 04/08/20 | Sold | -- | -- | -- |
| 03/09/2020 03/09/20 | Pending | -- | -- | -- |
| 03/04/2020 03/04/20 | For Sale | $237,000 | +48.2% | $300 / Sq Ft |
| 01/01/2020 01/01/20 | Pending | -- | -- | -- |
| 08/04/2017 08/04/17 | Sold | -- | -- | -- |
| 07/24/2017 07/24/17 | Sold | -- | -- | -- |
| 07/24/2017 07/24/17 | Sold | -- | -- | -- |
| 06/24/2017 06/24/17 | Pending | -- | -- | -- |
| 06/23/2017 06/23/17 | Sold | -- | -- | -- |
| 06/23/2017 06/23/17 | Sold | -- | -- | -- |
| 06/16/2017 06/16/17 | Sold | -- | -- | -- |
| 06/16/2017 06/16/17 | Sold | -- | -- | -- |
| 05/24/2017 05/24/17 | Pending | -- | -- | -- |
| 05/17/2017 05/17/17 | Pending | -- | -- | -- |
| 05/08/2017 05/08/17 | For Sale | $159,900 | -3.1% | $202 / Sq Ft |
| 04/24/2017 04/24/17 | Sold | -- | -- | -- |
| 03/25/2017 03/25/17 | For Sale | $165,000 | +22.3% | $209 / Sq Ft |
| 03/25/2017 03/25/17 | Pending | -- | -- | -- |
| 01/29/2017 01/29/17 | For Sale | $134,900 | -10.0% | $171 / Sq Ft |
| 01/01/2017 01/01/17 | Pending | -- | -- | -- |
| 01/01/2017 01/01/17 | Pending | -- | -- | -- |
| 01/01/2017 01/01/17 | Pending | -- | -- | -- |
| 01/01/2017 01/01/17 | Pending | -- | -- | -- |
| 11/16/2016 11/16/16 | For Sale | $149,900 | -46.4% | $190 / Sq Ft |
| 10/28/2016 10/28/16 | Sold | -- | -- | -- |
| 09/28/2016 09/28/16 | Pending | -- | -- | -- |
| 08/28/2016 08/28/16 | For Sale | $279,900 | +1.8% | $198 / Sq Ft |
| 12/29/2015 12/29/15 | Sold | -- | -- | -- |
| 08/28/2015 08/28/15 | Sold | -- | -- | -- |
| 08/28/2015 08/28/15 | Sold | -- | -- | -- |
| 08/27/2015 08/27/15 | Sold | -- | -- | -- |
| 08/27/2015 08/27/15 | Sold | -- | -- | -- |
| 08/03/2015 08/03/15 | For Sale | $275,000 | +2.2% | $203 / Sq Ft |
| 07/29/2015 07/29/15 | Pending | -- | -- | -- |
| 07/28/2015 07/28/15 | Pending | -- | -- | -- |
| 07/10/2015 07/10/15 | Sold | -- | -- | -- |
| 07/10/2015 07/10/15 | Sold | -- | -- | -- |
| 06/10/2015 06/10/15 | Pending | -- | -- | -- |
| 04/03/2015 04/03/15 | For Sale | $269,000 | +92.3% | $190 / Sq Ft |
| 01/01/2015 01/01/15 | Pending | -- | -- | -- |
| 01/01/2015 01/01/15 | Pending | -- | -- | -- |
| 10/09/2014 10/09/14 | For Sale | $139,900 | 0.0% | $177 / Sq Ft |
| 10/09/2014 10/09/14 | For Sale | $139,900 | -48.2% | $177 / Sq Ft |
| 09/16/2014 09/16/14 | Sold | -- | -- | -- |
| 09/11/2014 09/11/14 | Sold | -- | -- | -- |
| 08/17/2014 08/17/14 | Pending | -- | -- | -- |
| 07/24/2014 07/24/14 | For Sale | $269,900 | -1.9% | $219 / Sq Ft |
| 05/27/2014 05/27/14 | For Sale | $275,000 | 0.0% | $195 / Sq Ft |
| 05/08/2014 05/08/14 | Sold | -- | -- | -- |
| 05/08/2014 05/08/14 | Sold | -- | -- | -- |
| 04/08/2014 04/08/14 | Pending | -- | -- | -- |
| 04/02/2014 04/02/14 | Sold | -- | -- | -- |
| 01/31/2014 01/31/14 | For Sale | $275,000 | +10.0% | $223 / Sq Ft |
| 01/01/2014 01/01/14 | Pending | -- | -- | -- |
| 01/01/2014 01/01/14 | Pending | -- | -- | -- |
| 01/01/2014 01/01/14 | Pending | -- | -- | -- |
| 01/01/2014 01/01/14 | Pending | -- | -- | -- |
| 04/22/2013 04/22/13 | For Sale | $249,900 | +31.5% | $203 / Sq Ft |
| 02/17/2012 02/17/12 | Sold | -- | -- | -- |
| 01/01/2012 01/01/12 | Pending | -- | -- | -- |
| 11/01/2010 11/01/10 | For Sale | $190,000 | -- | $134 / Sq Ft |
Source: South Texas MLS
Tax History Compared to Growth
Tax History
| Year | Tax Paid | Tax Assessment Tax Assessment Total Assessment is a certain percentage of the fair market value that is determined by local assessors to be the total taxable value of land and additions on the property. | Land | Improvement |
|---|---|---|---|---|
| 2024 | $47 | $4,000 | $4,000 | $0 |
| 2023 | $47 | $4,000 | $4,000 | $0 |
| 2022 | $56 | $4,000 | $4,000 | $0 |
| 2021 | $44 | $3,200 | $3,200 | $0 |
| 2020 | $135 | $3,200 | $3,200 | $0 |
| 2019 | $135 | $3,200 | $3,200 | $0 |
| 2018 | $135 | $3,200 | $3,200 | $0 |
| 2017 | -- | $3,200 | $3,200 | $0 |
| 2014 | -- | $3,200 | $3,200 | $0 |
Source: Public Records
Agents Affiliated with this Home
-
Alissa Spears
Seller's Agent in 2025
Alissa Spears
Spears & Co Real Estate
(361) 790-6585
452 Total Sales
-
Sandy Swanson
Seller's Agent in 2025
Sandy Swanson
Key Allegro Real Estate
(361) 790-4199
88 Total Sales
-
John Kidwell
Seller's Agent in 2025
John Kidwell
Key Allegro Real Estate
(361) 548-3691
188 Total Sales
-
Robin Martin
Seller's Agent in 2025
Robin Martin
Key Allegro Real Estate
(361) 463-1079
134 Total Sales
-
Tara Layne Lewis
Buyer's Agent in 2025
Tara Layne Lewis
The Ron Brown Company
(830) 263-8623
27 Total Sales
-
Kelly Blackwell
Seller's Agent in 2024
Kelly Blackwell
SPEARS & COMPANY REAL ESTATE
(361) 564-8508
160 Total Sales
Map
Source: South Texas MLS
MLS Number: 357967
APN: R52799
Nearby Homes
- 2292 N Fulton Beach Rd Unit 608
- 2292 N Fulton Beach Rd Unit 101
- 2292 N Fulton Beach Rd Unit 502
- 2292 N Fulton Beach Rd Unit 202
- 2292 N Fulton Beach Rd Unit 702
- 6 Sea Shell Shores Dr
- 2290 N Fulton Beach Rd Unit 315
- 2290 N Fulton Beach Rd
- 2290 N Fulton Beach Rd Unit 219
- 13 Sea Shell Shores Dr
- 128 Breezeway Dr
- 129 Breezeway Dr
- 152 Breezeway Dr
- 137 Breezeway Dr
- 502 Sailhouse Way
- 148 Breezeway Dr
- 140 Breezeway Dr
- 144 Breezeway Dr