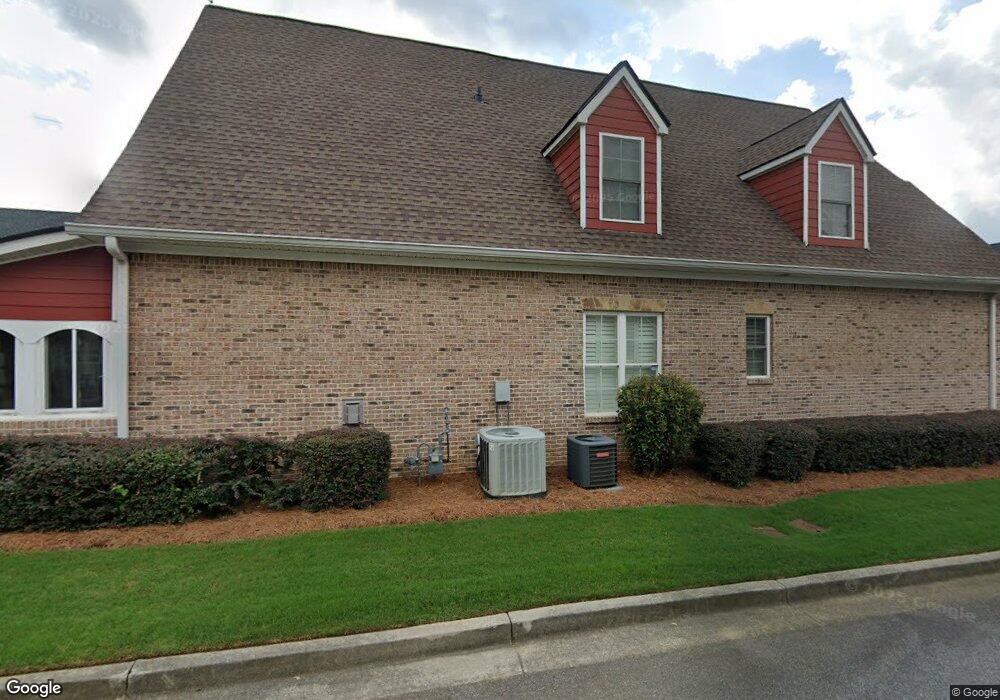
2292 Sandy Oaks Dr Unit 29 Marietta, GA 30066
Sandy Plains NeighborhoodEstimated Value: $530,000 - $591,000
3
Beds
3
Baths
2,397
Sq Ft
$236/Sq Ft
Est. Value
About This Home
This home is located at 2292 Sandy Oaks Dr Unit 29, Marietta, GA 30066 and is currently estimated at $566,460, approximately $236 per square foot. 2292 Sandy Oaks Dr Unit 29 is a home located in Cobb County with nearby schools including Kincaid Elementary School, Daniell Middle School, and Sprayberry High School.
Ownership History
Date
Name
Owned For
Owner Type
Purchase Details
Closed on
May 19, 2021
Sold by
Julia Lopez
Bought by
Pullen James Terrell
Current Estimated Value
Purchase Details
Closed on
Feb 22, 2021
Sold by
Sandy Plains Development Group Llc
Bought by
Pullen James T and Pullen Diane F
Purchase Details
Closed on
Nov 2, 2020
Sold by
Pullen James Terrell and Estate Of Diane Fisher Pullen
Bought by
Pullen James T
Purchase Details
Closed on
Dec 23, 2009
Sold by
Sandy Plais Dev Grp Llc
Bought by
Pullen James T and Pullen Diane F
Home Financials for this Owner
Home Financials are based on the most recent Mortgage that was taken out on this home.
Original Mortgage
$298,700
Interest Rate
4.82%
Mortgage Type
Trade
Create a Home Valuation Report for This Property
The Home Valuation Report is an in-depth analysis detailing your home's value as well as a comparison with similar homes in the area
Home Values in the Area
Average Home Value in this Area
Purchase History
| Date | Buyer | Sale Price | Title Company |
|---|---|---|---|
| Pullen James Terrell | $37,500 | Moore Ingram Johnson & Steele | |
| Pullen James Terrell | $150,000 | Moore Ingram Johnson & Steele | |
| Pullen James Terrell | -- | None Listed On Document | |
| Pullen James T | -- | None Available | |
| Pullen James T | -- | None Available | |
| Pullen James T | $373,400 | -- |
Source: Public Records
Mortgage History
| Date | Status | Borrower | Loan Amount |
|---|---|---|---|
| Previous Owner | Pullen James T | $298,700 |
Source: Public Records
Tax History Compared to Growth
Tax History
| Year | Tax Paid | Tax Assessment Tax Assessment Total Assessment is a certain percentage of the fair market value that is determined by local assessors to be the total taxable value of land and additions on the property. | Land | Improvement |
|---|---|---|---|---|
| 2025 | $1,886 | $213,544 | $52,000 | $161,544 |
| 2024 | $1,821 | $190,356 | $48,000 | $142,356 |
| 2023 | $1,615 | $190,356 | $48,000 | $142,356 |
| 2022 | $1,725 | $158,004 | $38,000 | $120,004 |
| 2021 | $1,725 | $158,004 | $38,000 | $120,004 |
| 2020 | $1,398 | $158,004 | $38,000 | $120,004 |
| 2019 | $1,398 | $158,004 | $38,000 | $120,004 |
| 2018 | $1,311 | $128,856 | $38,000 | $90,856 |
| 2017 | $1,119 | $122,708 | $38,000 | $84,708 |
| 2016 | $1,120 | $122,708 | $38,000 | $84,708 |
| 2015 | $1,184 | $119,432 | $30,000 | $89,432 |
| 2014 | $1,206 | $119,432 | $0 | $0 |
Source: Public Records
Map
Nearby Homes
- 2314 Sandy Oaks Dr
- 2116 Morgan Rd NE
- 2065 Mozelle Dr
- 2020 Starlight Dr
- 1780 Kinridge Rd
- 1505 Kincaid Rd
- 2725 Stillwater Lake Ln Unit 2
- 2729 Stillwater Lake Ln Unit 1
- 1748 Brown Cir
- 2591 Alcovy Trail NE
- 2588 Alcovy Trail NE
- 1972 Granite Mill Rd
- 1822 Hasty Rd
- 2072 Fairport Way
- 1756 Brown Cir
- 2742 Bob Bettis Rd
- 1919 Redfield Rd NE Unit Homesite 19
- 1935 Redfield Rd NE
- 1939 Redfield Rd NE
- 2252 Carefree Cir Unit 3
- 2292 Sandy Oaks Dr
- 2286 Sandy Oaks Dr
- 2286 Sandy Oaks Dr Unit 30
- 2320 Sandy Oaks Dr
- 2320 Sandy Oaks Dr Unit 32
- 2291 Sandy Oaks Dr
- 2268 Sandy Oaks Dr
- 2268 Sandy Oaks Dr Unit 27
- 2297 Sandy Oaks Dr
- 2297 Sandy Oaks Dr Unit 19
- 2274 Sandy Oaks Dr Unit 28
- 2279 Sandy Oaks Dr
- 2279 Sandy Oaks Dr Unit 2279
- 2279 Sandy Oaks Dr Unit 11
- 2279 Sandy Oaks Dr Unit 21
- 2309 Sandy Oaks Dr
- 2273 Sandy Oaks Dr
- 2273 Sandy Oaks Dr Unit 2273
- 2273 Sandy Oaks Dr Unit 22
- 2256 Sandy Oaks Dr