2293 I St Petaluma, CA 94952
Estimated Value: $948,000 - $1,071,203
About This Home
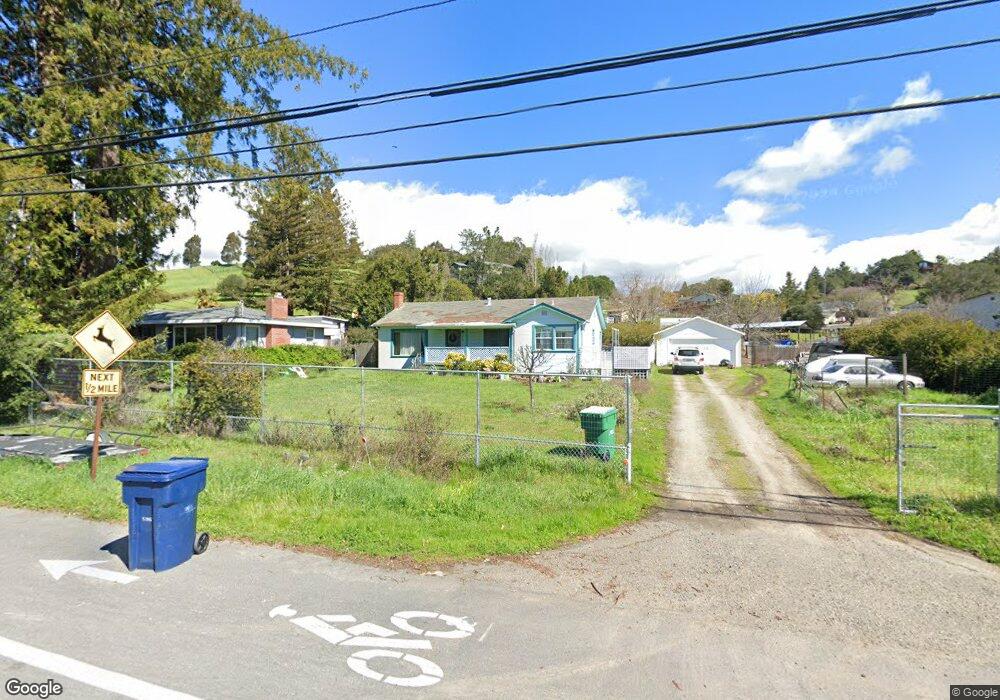
This home is located at 2293 I St, Petaluma, CA 94952 and is currently estimated at $1,025,301, approximately $676 per square foot. 2293 I St is a home located in Sonoma County with nearby schools including Grant Elementary School, Petaluma Junior High School, and Petaluma High School.
Ownership History
We collect this data history from publicly available records. To have your information removed, we recommend requesting removal directly through your county’s website.
Purchase Details
Home Financials for this Owner
Home Financials are based on the most recent Mortgage that was taken out on this home.Purchase Details
Home Financials for this Owner
Home Financials are based on the most recent Mortgage that was taken out on this home.Purchase Details
Purchase History
We collect this data history from publicly available records. To have your information removed, we recommend requesting removal directly through your county’s website.
| Date | Buyer | Sale Price | Title Company |
|---|---|---|---|
| -- | Fidelity National Title Co | ||
| $440,000 | Fidelity National Title Co | ||
| -- | -- |
Mortgage History
We collect this data history from publicly available records. To have your information removed, we recommend requesting removal directly through your county’s website.
| Date | Status | Borrower | Loan Amount |
|---|---|---|---|
| Open | $227,000 | ||
| Closed | $240,000 |
Tax History
We collect this data history from publicly available records. To have your information removed, we recommend requesting removal directly through your county’s website.
| Year | Tax Paid | Tax Assessment Tax Assessment Total Assessment is a certain percentage of the fair market value that is determined by local assessors to be the total taxable value of land and additions on the property. | Land | Improvement |
|---|---|---|---|---|
| 2025 | $6,617 | $548,568 | $291,025 | $257,543 |
| 2024 | $6,188 | $537,813 | $285,319 | $252,494 |
| 2023 | $6,188 | $527,269 | $279,725 | $247,544 |
| 2022 | $5,715 | $516,932 | $274,241 | $242,691 |
| 2021 | $5,607 | $506,797 | $268,864 | $237,933 |
| 2020 | $5,654 | $501,602 | $266,108 | $235,494 |
| 2019 | $5,583 | $491,768 | $260,891 | $230,877 |
| 2018 | $5,561 | $482,126 | $255,776 | $226,350 |
| 2017 | $5,444 | $472,673 | $250,761 | $221,912 |
| 2016 | $5,313 | $463,406 | $245,845 | $217,561 |
| 2015 | -- | $456,447 | $242,153 | $214,294 |
| 2014 | -- | $447,507 | $237,410 | $210,097 |
Map
- 113 Greenridge Ct
- 1000 E Sunnyslope Rd
- 1108 E Sunnyslope Rd
- 156 Grant Ct
- 32 Colinda Dr
- 22 Oak Knoll Ct
- 45 Augusta Cir
- 5 Sunny Hill Dr
- 733 I St
- 21 Branching Way
- 1121 F St
- 8 Grandview Ave
- 2 1/2 Grandview Ave
- 504 Ruby St
- 1121 Brighton View Cir
- 1028 Addison Cir
- 589 Sapphire St
- 853 D St
- 13 El Rose Dr
- 2300 D Street Extension
- 2325 I St
- 2235 I St
- 2341 I St
- 2205 I St
- 100 Westridge Dr
- 41 Purrington Rd
- 99 Westridge Dr
- 45 Purrington Rd
- 104 Westridge Dr
- 122 Greenridge Ct
- 101 Westridge Dr
- 125 Greenridge Ct
- 108 Westridge Dr
- 103 Westridge Dr
- 118 Greenridge Ct
- 2386 I Street Extension
- 71 Purrington Rd
- 121 Greenridge Ct
- 107 Westridge Dr
- 112 Westridge Dr
Ask me questions while you tour the home.