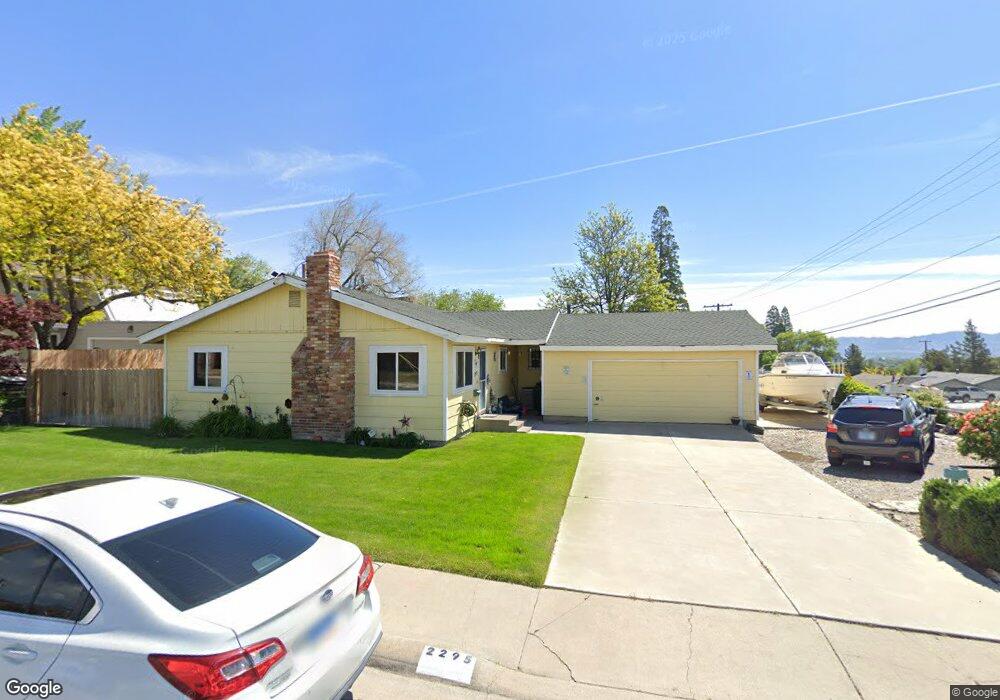
2295 W 7th St Reno, NV 89503
Kings Row NeighborhoodEstimated Value: $431,000 - $462,000
3
Beds
2
Baths
1,285
Sq Ft
$345/Sq Ft
Est. Value
About This Home
This home is located at 2295 W 7th St, Reno, NV 89503 and is currently estimated at $443,909, approximately $345 per square foot. 2295 W 7th St is a home located in Washoe County with nearby schools including Elmcrest Elementary School, Archie Clayton Pre-AP Academy, and Robert McQueen High School.
Ownership History
Date
Name
Owned For
Owner Type
Purchase Details
Closed on
Jun 30, 2020
Sold by
Long Gloria A
Bought by
Long Cheryl A
Current Estimated Value
Home Financials for this Owner
Home Financials are based on the most recent Mortgage that was taken out on this home.
Original Mortgage
$254,800
Interest Rate
2.9%
Mortgage Type
New Conventional
Create a Home Valuation Report for This Property
The Home Valuation Report is an in-depth analysis detailing your home's value as well as a comparison with similar homes in the area
Home Values in the Area
Average Home Value in this Area
Purchase History
| Date | Buyer | Sale Price | Title Company |
|---|---|---|---|
| Long Cheryl A | $300,000 | Amrock Inc |
Source: Public Records
Mortgage History
| Date | Status | Borrower | Loan Amount |
|---|---|---|---|
| Previous Owner | Long Cheryl A | $254,800 |
Source: Public Records
Tax History Compared to Growth
Tax History
| Year | Tax Paid | Tax Assessment Tax Assessment Total Assessment is a certain percentage of the fair market value that is determined by local assessors to be the total taxable value of land and additions on the property. | Land | Improvement |
|---|---|---|---|---|
| 2025 | $976 | $54,812 | $35,816 | $18,996 |
| 2024 | $948 | $52,469 | $33,737 | $18,733 |
| 2023 | $948 | $52,614 | $35,280 | $17,334 |
| 2022 | $921 | $42,450 | $28,350 | $14,100 |
| 2021 | $853 | $32,904 | $19,121 | $13,783 |
| 2020 | $801 | $31,515 | $17,987 | $13,528 |
| 2019 | $763 | $31,052 | $18,270 | $12,782 |
| 2018 | $729 | $25,268 | $13,010 | $12,258 |
| 2017 | $699 | $24,309 | $12,269 | $12,040 |
| 2016 | $682 | $22,824 | $10,773 | $12,051 |
| 2015 | $680 | $20,967 | $9,144 | $11,823 |
| 2014 | $660 | $19,315 | $8,146 | $11,169 |
| 2013 | -- | $17,321 | $5,819 | $11,502 |
Source: Public Records
Map
Nearby Homes