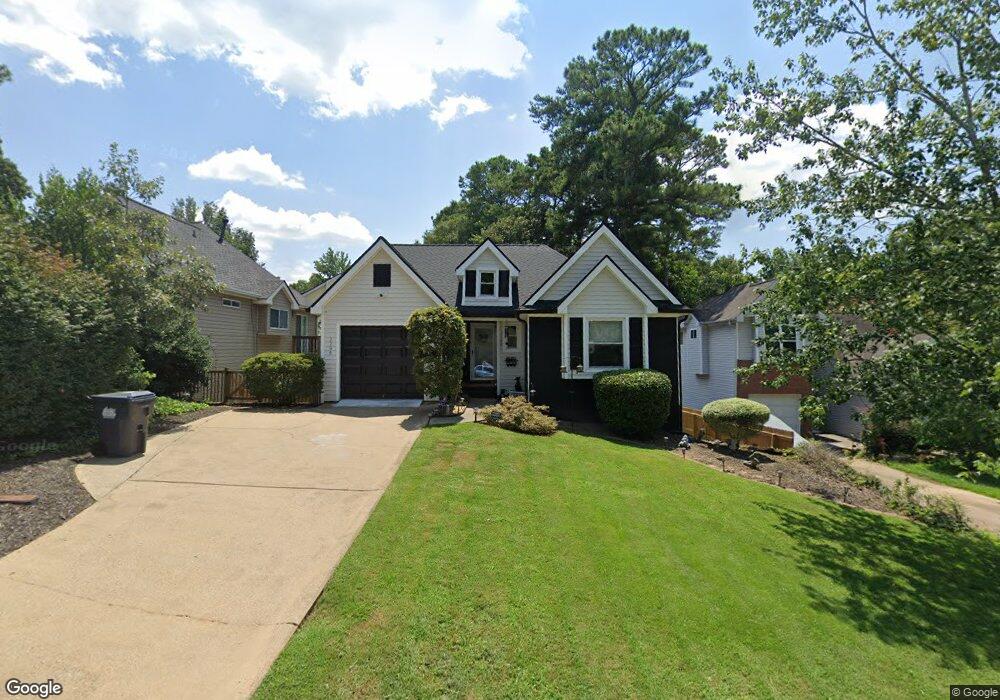
2296 Collinworth Dr Marietta, GA 30062
Eastern Marietta NeighborhoodEstimated Value: $402,000 - $437,000
3
Beds
3
Baths
1,102
Sq Ft
$375/Sq Ft
Est. Value
About This Home
This home is located at 2296 Collinworth Dr, Marietta, GA 30062 and is currently estimated at $413,099, approximately $374 per square foot. 2296 Collinworth Dr is a home located in Cobb County with nearby schools including Sedalia Park Elementary School, East Cobb Middle School, and Wheeler High School.
Ownership History
Date
Name
Owned For
Owner Type
Purchase Details
Closed on
Aug 16, 2013
Sold by
Stultz Jennifer E
Bought by
Blocker Bianca
Current Estimated Value
Home Financials for this Owner
Home Financials are based on the most recent Mortgage that was taken out on this home.
Original Mortgage
$174,775
Outstanding Balance
$128,842
Interest Rate
4.25%
Mortgage Type
FHA
Estimated Equity
$284,257
Purchase Details
Closed on
Mar 3, 2003
Sold by
Quevedo Bill
Bought by
Liggett Jennifer
Home Financials for this Owner
Home Financials are based on the most recent Mortgage that was taken out on this home.
Original Mortgage
$155,400
Interest Rate
5.88%
Mortgage Type
New Conventional
Purchase Details
Closed on
Oct 30, 1998
Sold by
Cox David Ronald
Bought by
Quevedo Bill
Home Financials for this Owner
Home Financials are based on the most recent Mortgage that was taken out on this home.
Original Mortgage
$116,200
Interest Rate
6.65%
Mortgage Type
New Conventional
Create a Home Valuation Report for This Property
The Home Valuation Report is an in-depth analysis detailing your home's value as well as a comparison with similar homes in the area
Home Values in the Area
Average Home Value in this Area
Purchase History
| Date | Buyer | Sale Price | Title Company |
|---|---|---|---|
| Blocker Bianca | $178,000 | -- | |
| Liggett Jennifer | $155,500 | -- | |
| Quevedo Bill | $119,900 | -- |
Source: Public Records
Mortgage History
| Date | Status | Borrower | Loan Amount |
|---|---|---|---|
| Open | Blocker Bianca | $174,775 | |
| Previous Owner | Liggett Jennifer | $155,400 | |
| Previous Owner | Quevedo Bill | $116,200 |
Source: Public Records
Tax History Compared to Growth
Tax History
| Year | Tax Paid | Tax Assessment Tax Assessment Total Assessment is a certain percentage of the fair market value that is determined by local assessors to be the total taxable value of land and additions on the property. | Land | Improvement |
|---|---|---|---|---|
| 2025 | $3,037 | $129,764 | $36,000 | $93,764 |
| 2024 | $3,039 | $129,764 | $36,000 | $93,764 |
| 2023 | $2,275 | $119,564 | $24,000 | $95,564 |
| 2022 | $2,777 | $116,704 | $24,000 | $92,704 |
| 2021 | $2,352 | $97,276 | $24,000 | $73,276 |
| 2020 | $2,352 | $97,276 | $24,000 | $73,276 |
| 2019 | $2,352 | $97,276 | $24,000 | $73,276 |
| 2018 | $1,923 | $77,668 | $19,200 | $58,468 |
| 2017 | $1,658 | $69,028 | $18,000 | $51,028 |
| 2016 | $1,660 | $69,028 | $18,000 | $51,028 |
| 2015 | $1,700 | $69,028 | $18,000 | $51,028 |
| 2014 | $1,481 | $58,676 | $0 | $0 |
Source: Public Records
Map
Nearby Homes
- 2251 Roswell Rd NE
- 974 Clydesdale Dr
- 2106 Blaylock Dr
- 2265 Fremont Dr
- 2289 Fremont Dr
- 2267 Valla Parc Ct
- 2414 Robin Hood Place NE
- 951 Woodmont Dr
- 2268 Orleans Ave
- 1941 Pine Bluff
- 774 Mary Ann Dr NE
- 915 Chipley Ct
- 1911 Woodmont Ct
- 1256 E Piedmont Rd
- 583 Spring Creek Way NE
- 1131 Hershey Dr
- 2650 Roswell Rd
- 2377 Emory Ln NE
- 507 Spring Creek Way NE Unit 2
- 2296 Collinworth Dr NE
- 2298 Collinworth Dr
- 2290 Collinworth Dr
- 911 Bradford Ln
- 2286 Collinworth Dr
- 909 Bradford Ln
- 2297 Collinworth Dr
- 915 Bradford Ln
- 2295 Collinworth Dr
- 2302 Collinworth Dr
- 2284 Collinworth Dr NE
- 0 Collinworth Dr Unit 7470284
- 0 Collinworth Dr Unit 3226194
- 0 Collinworth Dr Unit 8889147
- 0 Collinworth Dr Unit 7317781
- 0 Collinworth Dr Unit 3272874
- 0 Collinworth Dr Unit 7094502
- 0 Collinworth Dr Unit 3072132
- 0 Collinworth Dr
- 907 Bradford Ln