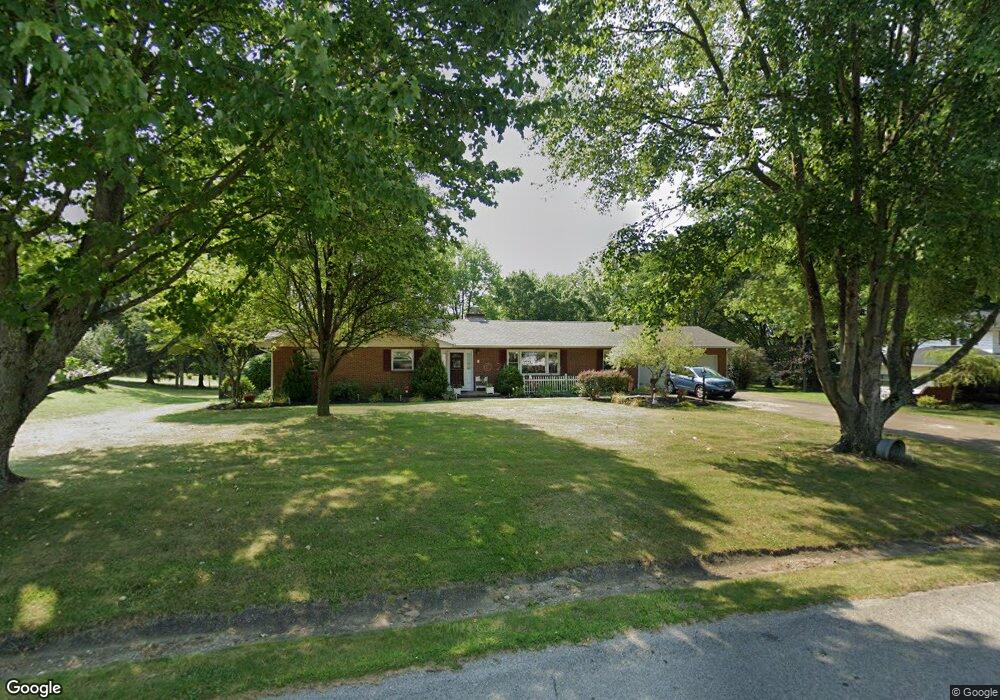
2296 Scenic Dr NE Lancaster, OH 43130
Estimated Value: $355,000 - $397,000
3
Beds
3
Baths
1,952
Sq Ft
$192/Sq Ft
Est. Value
About This Home
This home is located at 2296 Scenic Dr NE, Lancaster, OH 43130 and is currently estimated at $373,948, approximately $191 per square foot. 2296 Scenic Dr NE is a home located in Fairfield County with nearby schools including Medill Elementary School, Thomas Ewing Junior High School, and Lancaster High School.
Ownership History
Date
Name
Owned For
Owner Type
Purchase Details
Closed on
Dec 18, 2009
Sold by
Bowers Teresa S
Bought by
Cheney Charles Todd and Cheney Kellie Lea
Current Estimated Value
Home Financials for this Owner
Home Financials are based on the most recent Mortgage that was taken out on this home.
Original Mortgage
$141,432
Outstanding Balance
$92,817
Interest Rate
5.02%
Mortgage Type
FHA
Estimated Equity
$281,131
Purchase Details
Closed on
Nov 16, 2005
Sold by
Bowers Jeffrey J
Bought by
Bowers Teresa S
Purchase Details
Closed on
Sep 29, 1998
Sold by
Ford Charles E
Bought by
Bowers Jeffrey J and Bowers Teresa S
Home Financials for this Owner
Home Financials are based on the most recent Mortgage that was taken out on this home.
Original Mortgage
$15,000
Interest Rate
6.99%
Mortgage Type
New Conventional
Purchase Details
Closed on
Jun 17, 1992
Sold by
Perkins Michael E
Bought by
Ford Charles E
Purchase Details
Closed on
Jul 1, 1987
Create a Home Valuation Report for This Property
The Home Valuation Report is an in-depth analysis detailing your home's value as well as a comparison with similar homes in the area
Home Values in the Area
Average Home Value in this Area
Purchase History
| Date | Buyer | Sale Price | Title Company |
|---|---|---|---|
| Cheney Charles Todd | $159,000 | Valmer Land Title Agency | |
| Bowers Teresa S | -- | -- | |
| Bowers Jeffrey J | $134,900 | -- | |
| Ford Charles E | $105,000 | -- | |
| -- | $77,000 | -- |
Source: Public Records
Mortgage History
| Date | Status | Borrower | Loan Amount |
|---|---|---|---|
| Open | Cheney Charles Todd | $141,432 | |
| Previous Owner | Bowers Jeffrey J | $15,000 |
Source: Public Records
Tax History Compared to Growth
Tax History
| Year | Tax Paid | Tax Assessment Tax Assessment Total Assessment is a certain percentage of the fair market value that is determined by local assessors to be the total taxable value of land and additions on the property. | Land | Improvement |
|---|---|---|---|---|
| 2024 | $8,261 | $85,080 | $17,010 | $68,070 |
| 2023 | $3,421 | $85,080 | $17,010 | $68,070 |
| 2022 | $3,463 | $85,080 | $17,010 | $68,070 |
| 2021 | $2,911 | $69,570 | $17,010 | $52,560 |
| 2020 | $2,798 | $69,570 | $17,010 | $52,560 |
| 2019 | $2,670 | $69,570 | $17,010 | $52,560 |
| 2018 | $2,413 | $59,400 | $17,010 | $42,390 |
| 2017 | $2,414 | $59,400 | $17,010 | $42,390 |
| 2016 | $2,238 | $59,400 | $17,010 | $42,390 |
| 2015 | $2,235 | $57,530 | $17,010 | $40,520 |
| 2014 | $2,132 | $57,530 | $17,010 | $40,520 |
| 2013 | $2,132 | $57,530 | $17,010 | $40,520 |
Source: Public Records
Map
Nearby Homes
- 2149 Pleasantview Dr NE
- 0 Old Millersport Rd NE Unit Lot 10 225033491
- 0 Old Millersport Rd NE Unit 225010386
- 0 Old Millersport Rd NE Unit Tract 8 224028101
- 2444 Sheridan Dr
- 1700 Rosewood Dr NE
- 1801 Pleasantview Dr NE
- 1760 Rainbow Dr NE
- 715 Sherman Bluff Way Unit 14715
- 706 Sherman Bluff Way Unit 1706
- 0 Tschopp Rd NE Unit Lot 33 225027324
- 0 Tschopp Rd NE Unit Lot 17 225027320
- 1976 Breed Hill Ct
- 1669 Lexington Dr
- 1916 Country Place
- 980 Coonpath Rd NE
- 0 Declaration Dr W Unit 219044159
- 3155 Old Millersport Rd NE
- 3155 Old Millersport Rd NE Unit Lot 11
- 1750 Coonpath Rd NE Unit Tract 5
- 2290 Scenic Dr NE
- 2302 Scenic Dr NE
- 2310 Scenic Dr NE
- 2295 Scenic Dr NE
- 2166 Sunnyhill Dr NE
- 2224 Sunnyhill Dr NE
- 2252 Sunnyhill Dr NE
- 2176 Sunnyhill Dr NE
- 2176 Sunnyhill Dr NE
- 2305 Scenic Dr NE
- 2156 Sunnyhill Dr NE
- 2318 Scenic Dr NE
- 2276 Sunnyhill Dr NE
- 2146 Sunnyhill Dr NE
- 2311 Scenic Dr NE
- 2324 Scenic Dr NE
- 2296 Sunnyhill Dr NE
- 2334 Scenic Dr NE
- 2317 Scenic Dr NE
- 2126 Sunnyhill Dr NE