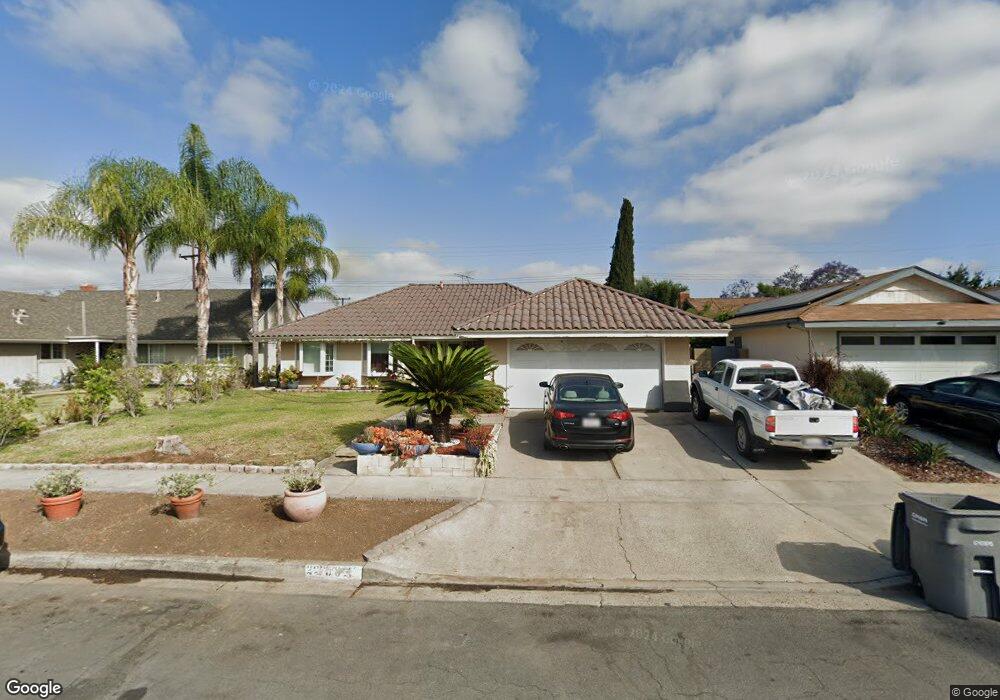
22961 Cavanaugh Rd Lake Forest, CA 92630
Estimated Value: $1,114,622 - $1,250,000
3
Beds
2
Baths
1,365
Sq Ft
$869/Sq Ft
Est. Value
About This Home
This home is located at 22961 Cavanaugh Rd, Lake Forest, CA 92630 and is currently estimated at $1,186,406, approximately $869 per square foot. 22961 Cavanaugh Rd is a home located in Orange County with nearby schools including Olivewood Elementary School, Serrano Intermediate School, and El Toro High School.
Ownership History
Date
Name
Owned For
Owner Type
Purchase Details
Closed on
Feb 16, 2001
Sold by
Fukuyama Mark and Fukuyama Stephanie
Bought by
Amador Manuel C and Amador Rosa M
Current Estimated Value
Home Financials for this Owner
Home Financials are based on the most recent Mortgage that was taken out on this home.
Original Mortgage
$225,000
Interest Rate
7.06%
Purchase Details
Closed on
Oct 11, 1995
Sold by
Black Vivian and Campbell Jesse E
Bought by
Fukuyama Mark and Fukuyama Stephanie
Home Financials for this Owner
Home Financials are based on the most recent Mortgage that was taken out on this home.
Original Mortgage
$164,900
Interest Rate
7.67%
Create a Home Valuation Report for This Property
The Home Valuation Report is an in-depth analysis detailing your home's value as well as a comparison with similar homes in the area
Home Values in the Area
Average Home Value in this Area
Purchase History
| Date | Buyer | Sale Price | Title Company |
|---|---|---|---|
| Amador Manuel C | $260,000 | Commonwealth Land Title | |
| Fukuyama Mark | $170,000 | Orange Coast Title |
Source: Public Records
Mortgage History
| Date | Status | Borrower | Loan Amount |
|---|---|---|---|
| Previous Owner | Amador Manuel C | $225,000 | |
| Previous Owner | Fukuyama Mark | $164,900 |
Source: Public Records
Tax History
| Year | Tax Paid | Tax Assessment Tax Assessment Total Assessment is a certain percentage of the fair market value that is determined by local assessors to be the total taxable value of land and additions on the property. | Land | Improvement |
|---|---|---|---|---|
| 2025 | $3,970 | $391,771 | $296,515 | $95,256 |
| 2024 | $3,970 | $384,090 | $290,701 | $93,389 |
| 2023 | $3,876 | $376,559 | $285,001 | $91,558 |
| 2022 | $3,807 | $369,176 | $279,413 | $89,763 |
| 2021 | $3,731 | $361,938 | $273,935 | $88,003 |
| 2020 | $3,698 | $358,227 | $271,126 | $87,101 |
| 2019 | $3,625 | $351,203 | $265,809 | $85,394 |
| 2018 | $3,557 | $344,317 | $260,597 | $83,720 |
| 2017 | $3,486 | $337,566 | $255,487 | $82,079 |
| 2016 | $3,429 | $330,948 | $250,478 | $80,470 |
| 2015 | $3,387 | $325,977 | $246,715 | $79,262 |
| 2014 | $3,314 | $319,592 | $241,882 | $77,710 |
Source: Public Records
Map
Nearby Homes
- 24492 Blackfoot Dr
- 22802 Belquest Dr
- 22839 Ridge Route Ln
- 23216 Orange Ave Unit 6
- 23214 Orange Ave Unit 7
- 23298 Orange Ave Unit#4
- 23224 Orange Ave Unit 5
- 23294 Orange Ave Unit 6
- 22921 Crol Ln
- 22844 Mesa Way Unit 2
- 23276 Orange Ave Unit 8
- 23372 Dune Mear Rd
- 25365 Vía Verde
- 24921 Muirlands Blvd Unit 236
- 24921 Muirlands Blvd Unit 13
- 24921 Muirlands Blvd
- 24921 Muirlands Blvd Unit 168
- 24921 Muirlands Blvd Unit 265
- 24921 Muirlands Blvd Unit 23
- 24921 Muirlands Blvd Unit 326
- 22951 Cavanaugh Rd
- 22971 Cavanaugh Rd
- 22942 Dune Mear Rd
- 22941 Cavanaugh Rd
- 22991 Cavanaugh Rd
- 22952 Dune Mear Rd
- 22932 Dune Mear Rd
- 22972 Dune Mear Rd
- 22962 Cavanaugh Rd
- 22952 Cavanaugh Rd
- 22922 Dune Mear Rd
- 22931 Cavanaugh Rd
- 23001 Cavanaugh Rd
- 22972 Cavanaugh Rd
- 22942 Cavanaugh Rd
- 22992 Cavanaugh Rd
- 22982 Dune Mear Rd
- 22912 Dune Mear Rd
- 22932 Cavanaugh Rd
- 23011 Cavanaugh Rd
Your Personal Tour Guide
Ask me questions while you tour the home.