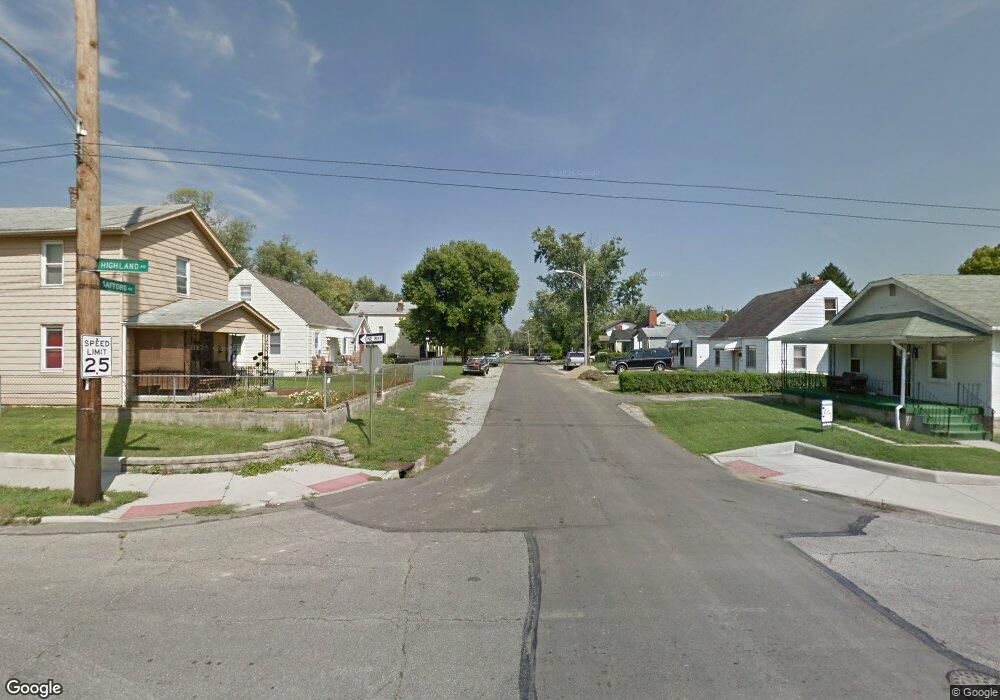
2299 Safford Ave Columbus, OH 43223
South Central Hilltop NeighborhoodEstimated Value: $453,699 - $521,000
3
Beds
3
Baths
2,161
Sq Ft
$220/Sq Ft
Est. Value
About This Home
This home is located at 2299 Safford Ave, Columbus, OH 43223 and is currently estimated at $474,925, approximately $219 per square foot. 2299 Safford Ave is a home located in Franklin County with nearby schools including Lindbergh Elementary School, Hilltonia Middle School, and Briggs High School.
Ownership History
Date
Name
Owned For
Owner Type
Purchase Details
Closed on
Nov 18, 2016
Sold by
Poldemann Kristin and Poldemann Wayne
Bought by
Nassar Marie Jo
Current Estimated Value
Home Financials for this Owner
Home Financials are based on the most recent Mortgage that was taken out on this home.
Original Mortgage
$224,000
Outstanding Balance
$180,116
Interest Rate
3.47%
Mortgage Type
New Conventional
Estimated Equity
$294,809
Purchase Details
Closed on
Nov 20, 2002
Sold by
Tmb Investments Ltd
Bought by
Poldemann Kristin
Home Financials for this Owner
Home Financials are based on the most recent Mortgage that was taken out on this home.
Original Mortgage
$168,850
Interest Rate
4.5%
Mortgage Type
Purchase Money Mortgage
Purchase Details
Closed on
Jun 17, 1988
Purchase Details
Closed on
Feb 1, 1986
Create a Home Valuation Report for This Property
The Home Valuation Report is an in-depth analysis detailing your home's value as well as a comparison with similar homes in the area
Home Values in the Area
Average Home Value in this Area
Purchase History
| Date | Buyer | Sale Price | Title Company |
|---|---|---|---|
| Nassar Marie Jo | $280,000 | Peak Title | |
| Poldemann Kristin | $178,000 | -- | |
| -- | $125,000 | -- | |
| -- | $18,500 | -- |
Source: Public Records
Mortgage History
| Date | Status | Borrower | Loan Amount |
|---|---|---|---|
| Open | Nassar Marie Jo | $224,000 | |
| Previous Owner | Poldemann Kristin | $168,850 |
Source: Public Records
Tax History Compared to Growth
Tax History
| Year | Tax Paid | Tax Assessment Tax Assessment Total Assessment is a certain percentage of the fair market value that is determined by local assessors to be the total taxable value of land and additions on the property. | Land | Improvement |
|---|---|---|---|---|
| 2024 | $8,048 | $133,070 | $35,420 | $97,650 |
| 2023 | $7,935 | $133,070 | $35,420 | $97,650 |
| 2022 | $7,472 | $116,450 | $23,940 | $92,510 |
| 2021 | $7,593 | $116,450 | $23,940 | $92,510 |
| 2020 | $7,547 | $116,450 | $23,940 | $92,510 |
| 2019 | $7,096 | $96,920 | $19,950 | $76,970 |
| 2018 | $5,940 | $96,920 | $19,950 | $76,970 |
| 2017 | $5,639 | $96,920 | $19,950 | $76,970 |
| 2016 | $4,728 | $65,700 | $20,090 | $45,610 |
| 2015 | $4,757 | $65,700 | $20,090 | $45,610 |
| 2014 | $4,762 | $65,700 | $20,090 | $45,610 |
| 2013 | $2,417 | $65,695 | $20,090 | $45,605 |
Source: Public Records
Map
Nearby Homes
- 693 S Wayne Ave
- 724 S Eureka Ave
- 640 S Eureka Ave
- 558 S Oakley Ave Unit 60
- 545-547 S Highland Ave Unit 545
- 2188 Amherst Ave
- 2169 Amherst Ave
- 611 Whitethorne Ave
- 651 S Terrace Ave
- 599 Whitethorne Ave
- 2397 Sullivant Ave
- 734 S Richardson Ave
- 2205-2207 Sullivant Ave
- 727 S Richardson Ave
- 540 S Richardson Ave
- 2264 Shelton St
- 730 S Burgess Ave
- 453 S Eureka Ave
- 426 S Eureka Ave
- 509 Belvidere Ave
- 660 S Wheatland Ave
- 666 S Wheatland Ave Unit 668
- 664 S Wheatland Ave
- 646 S Wheatland Ave Unit 648
- 2292 Safford Ave
- 672 S Wheatland Ave Unit 674
- 655 S Wheatland Ave
- 640-642 S Wheatland Ave
- 640 S Wheatland Ave Unit 642
- 653 S Wheatland Ave Unit 655
- 2286 Safford Ave
- 643-645 S Wheatland Ave
- 665-667 S Wheatland Ave
- 665 S Wheatland Ave Unit 667
- 645 S Wheatland Ave Unit 45
- 643 S Wheatland Ave Unit 45
- 680 S Wheatland Ave Unit 682
- 653 S Highland Ave
- 671 S Wheatland Ave Unit 673
- 671-673-673 S Wheatland Ave Unit 671 S Wheatland