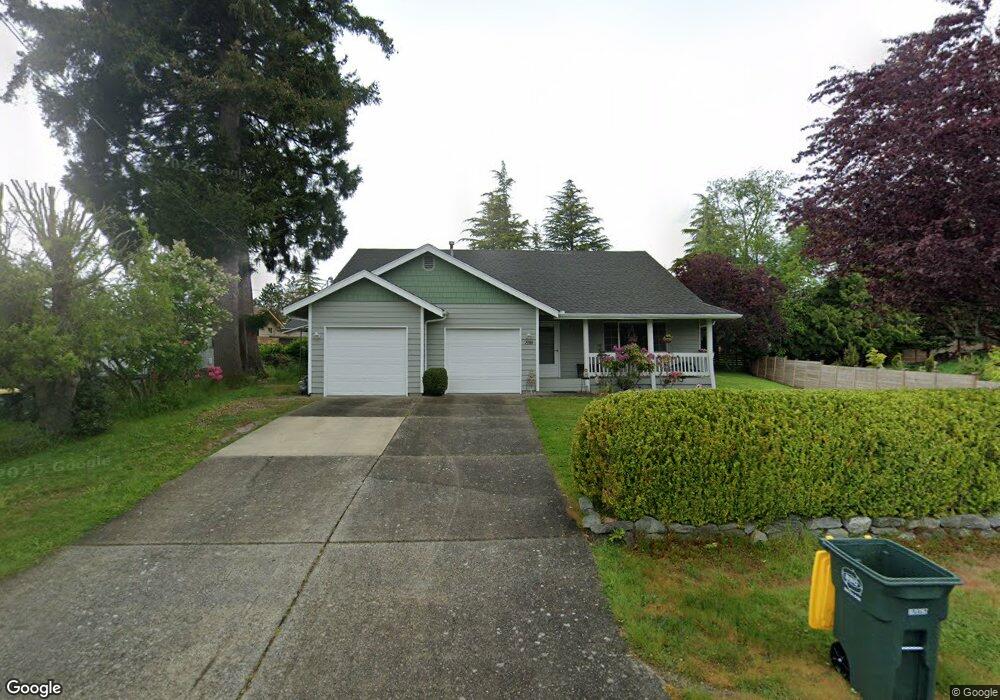
2299 View Ridge Dr Bellingham, WA 98229
Alabama Hill NeighborhoodEstimated Value: $666,000 - $754,000
3
Beds
2
Baths
1,408
Sq Ft
$507/Sq Ft
Est. Value
About This Home
This home is located at 2299 View Ridge Dr, Bellingham, WA 98229 and is currently estimated at $714,036, approximately $507 per square foot. 2299 View Ridge Dr is a home located in Whatcom County with nearby schools including Roosevelt Elementary School, Kulshan Middle School, and Bellingham High School.
Ownership History
Date
Name
Owned For
Owner Type
Purchase Details
Closed on
Jun 10, 2014
Sold by
Hemp Frederick L and Jean Hemp E
Bought by
Holliday Duane
Current Estimated Value
Home Financials for this Owner
Home Financials are based on the most recent Mortgage that was taken out on this home.
Original Mortgage
$49,500
Outstanding Balance
$37,721
Interest Rate
4.25%
Mortgage Type
Seller Take Back
Estimated Equity
$676,315
Purchase Details
Closed on
Apr 15, 2002
Sold by
Kapp Ryan D and Kapp Jenny E
Bought by
Holliday Duane H
Home Financials for this Owner
Home Financials are based on the most recent Mortgage that was taken out on this home.
Original Mortgage
$100,000
Interest Rate
6.87%
Purchase Details
Closed on
Apr 3, 2002
Sold by
Holliday Virginia A
Bought by
Holliday Duane H
Home Financials for this Owner
Home Financials are based on the most recent Mortgage that was taken out on this home.
Original Mortgage
$100,000
Interest Rate
6.87%
Create a Home Valuation Report for This Property
The Home Valuation Report is an in-depth analysis detailing your home's value as well as a comparison with similar homes in the area
Home Values in the Area
Average Home Value in this Area
Purchase History
| Date | Buyer | Sale Price | Title Company |
|---|---|---|---|
| Holliday Duane | $97,280 | Chicago Title Insurance | |
| Holliday Duane H | $174,500 | Stewart Title | |
| Holliday Duane H | -- | Stewart Title |
Source: Public Records
Mortgage History
| Date | Status | Borrower | Loan Amount |
|---|---|---|---|
| Open | Holliday Duane | $49,500 | |
| Previous Owner | Holliday Duane H | $100,000 |
Source: Public Records
Tax History Compared to Growth
Tax History
| Year | Tax Paid | Tax Assessment Tax Assessment Total Assessment is a certain percentage of the fair market value that is determined by local assessors to be the total taxable value of land and additions on the property. | Land | Improvement |
|---|---|---|---|---|
| 2024 | $5,185 | $638,199 | $244,441 | $393,758 |
| 2023 | $5,185 | $666,261 | $255,189 | $411,072 |
| 2022 | $4,486 | $584,440 | $223,850 | $360,590 |
| 2021 | $3,754 | $483,008 | $185,000 | $298,008 |
| 2020 | $3,629 | $381,458 | $147,982 | $233,476 |
| 2019 | $3,247 | $356,421 | $138,368 | $218,053 |
| 2018 | $3,360 | $319,688 | $124,118 | $195,570 |
| 2017 | $2,922 | $282,862 | $109,820 | $173,042 |
| 2016 | $2,674 | $257,094 | $99,940 | $157,154 |
| 2015 | $2,408 | $244,885 | $95,000 | $149,885 |
| 2014 | -- | $213,444 | $77,400 | $136,044 |
| 2013 | -- | $204,535 | $75,000 | $129,535 |
Source: Public Records
Map
Nearby Homes
- 2321 Crestline Dr
- 2209 W Birch St
- 3700 Alabama St Unit 316
- 2104 Birch Cir Unit 5C
- 2612 Birch St
- 2316 Xenia St
- 2735 Michigan St
- 2409 Xenia St
- 2138 Woburn St
- 2602 Woburn St
- 950 Yew St
- 2325 Valencia St
- 2330 Verona St
- 4020 Academy St
- 4000 Flynn St Unit 50
- 4000 Flynn St Unit 107
- 3153 Chandler Pkwy
- 3155 Chandler Pkwy
- 3159 Chandler Pkwy
- 0 Bonanza Way Unit NWM2327531
- 2295 View Ridge Dr
- 2301 View Ridge Dr
- 2304 Vining St
- 2307 View Ridge Dr
- 2214 Vining St
- 2221 View Ridge Dr
- 2310 Vining St
- 2311 View Ridge Dr
- 2212 Vining St
- 2217 View Ridge Dr
- 2317 View Ridge Dr
- 2316 Vining St
- 2306 View Ridge Dr
- 2305 Vining St
- 2315 Vining St
- 2300 View Ridge Dr
- 2310 View Ridge Dr
- 2220 View Ridge Dr
- 2325 Vining St
- 2208 Vining St