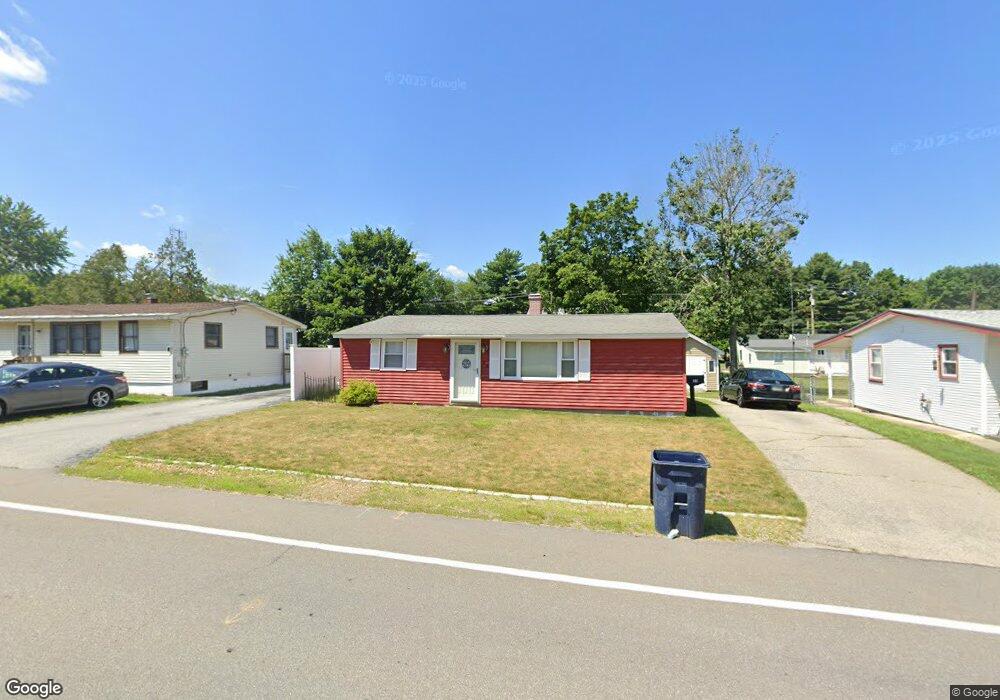
23 12th St Nashua, NH 03060
Mine Falls Park NeighborhoodEstimated Value: $353,000 - $369,000
2
Beds
1
Bath
925
Sq Ft
$391/Sq Ft
Est. Value
About This Home
This home is located at 23 12th St, Nashua, NH 03060 and is currently estimated at $361,867, approximately $391 per square foot. 23 12th St is a home located in Hillsborough County with nearby schools including Ledge Street Elementary School, Fairgrounds Middle School, and Nashua High School South.
Ownership History
Date
Name
Owned For
Owner Type
Purchase Details
Closed on
Apr 14, 2023
Sold by
Torres Luis F
Bought by
Torres Luis F and Torres Andrea K
Current Estimated Value
Purchase Details
Closed on
Jul 25, 2003
Sold by
Soucy-Levesque Cheryl
Bought by
Torres Luis F
Home Financials for this Owner
Home Financials are based on the most recent Mortgage that was taken out on this home.
Original Mortgage
$163,668
Interest Rate
5.27%
Mortgage Type
Purchase Money Mortgage
Purchase Details
Closed on
Jan 2, 2002
Sold by
Soucy Albert P
Bought by
Soucy-Levesque Cheryl
Home Financials for this Owner
Home Financials are based on the most recent Mortgage that was taken out on this home.
Original Mortgage
$87,800
Interest Rate
6.72%
Mortgage Type
Purchase Money Mortgage
Create a Home Valuation Report for This Property
The Home Valuation Report is an in-depth analysis detailing your home's value as well as a comparison with similar homes in the area
Home Values in the Area
Average Home Value in this Area
Purchase History
| Date | Buyer | Sale Price | Title Company |
|---|---|---|---|
| Torres Luis F | -- | None Available | |
| Torres Luis F | $165,000 | -- | |
| Soucy-Levesque Cheryl | $122,000 | -- |
Source: Public Records
Mortgage History
| Date | Status | Borrower | Loan Amount |
|---|---|---|---|
| Previous Owner | Soucy-Levesque Cheryl | $163,668 | |
| Previous Owner | Soucy-Levesque Cheryl | $87,800 |
Source: Public Records
Tax History Compared to Growth
Tax History
| Year | Tax Paid | Tax Assessment Tax Assessment Total Assessment is a certain percentage of the fair market value that is determined by local assessors to be the total taxable value of land and additions on the property. | Land | Improvement |
|---|---|---|---|---|
| 2024 | $4,687 | $294,800 | $126,900 | $167,900 |
| 2023 | $4,452 | $244,200 | $101,500 | $142,700 |
| 2022 | $4,413 | $244,200 | $101,500 | $142,700 |
| 2021 | $3,836 | $165,200 | $67,700 | $97,500 |
| 2020 | $3,697 | $163,500 | $67,700 | $95,800 |
| 2019 | $3,558 | $163,500 | $67,700 | $95,800 |
| 2018 | $3,468 | $163,500 | $67,700 | $95,800 |
| 2017 | $3,381 | $131,100 | $60,500 | $70,600 |
| 2016 | $3,287 | $131,100 | $60,500 | $70,600 |
| 2015 | $3,216 | $131,100 | $60,500 | $70,600 |
| 2014 | $3,153 | $131,100 | $60,500 | $70,600 |
Source: Public Records
Map
Nearby Homes
- 22 New Dunstable Rd Unit 132133
- 41 New Dunstable Rd Unit 371
- 32-34 Grand Ave
- 169A W Hollis St Unit 193
- 22 Kern Dr
- 4 Badger St
- 11 Bordeaux St
- 30 Ledge St
- 22 Wilder St
- 29 Wilder St
- 7 Bitirnas St Unit U7
- 38 Central St
- 97 Linwood St
- 121 Palm St
- 8 Buck St Unit 10
- 247 Main Dunstable Rd
- 11 Charles St
- 63 Dexter St
- 0 Baldwin St
- 15 Lovell St Unit 20