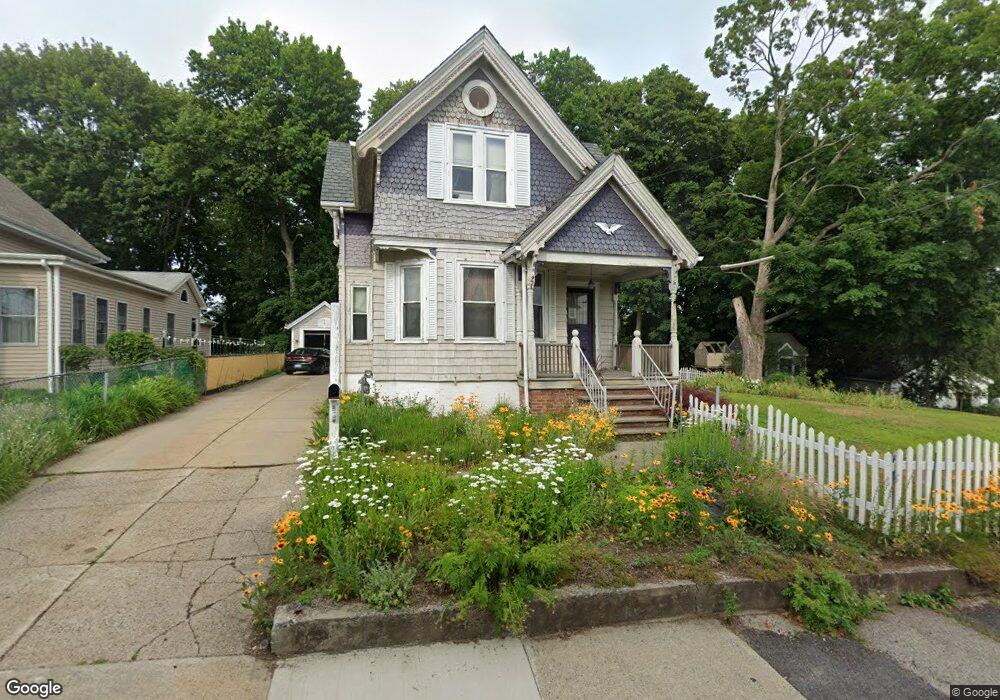
23 Abbott St Cumberland, RI 02864
Valley Falls NeighborhoodEstimated Value: $1,128,000 - $1,284,000
4
Beds
4
Baths
4,100
Sq Ft
$286/Sq Ft
Est. Value
About This Home
This home is located at 23 Abbott St, Cumberland, RI 02864 and is currently estimated at $1,171,490, approximately $285 per square foot. 23 Abbott St is a home located in Providence County with nearby schools including B.F. Norton Elementary School, Joseph L. McCourt Middle School, and Cumberland High School.
Ownership History
Date
Name
Owned For
Owner Type
Purchase Details
Closed on
Sep 14, 2018
Sold by
Iannitti Tammy J
Bought by
Iannitti Tammy J and Iannitti Thomas V
Current Estimated Value
Purchase Details
Closed on
Jun 6, 2018
Sold by
Varum Carlos M and Varum Isabel S
Bought by
Iannitti Tammy J
Home Financials for this Owner
Home Financials are based on the most recent Mortgage that was taken out on this home.
Original Mortgage
$456,000
Interest Rate
4.5%
Mortgage Type
Purchase Money Mortgage
Create a Home Valuation Report for This Property
The Home Valuation Report is an in-depth analysis detailing your home's value as well as a comparison with similar homes in the area
Home Values in the Area
Average Home Value in this Area
Purchase History
| Date | Buyer | Sale Price | Title Company |
|---|---|---|---|
| Iannitti Tammy J | -- | -- | |
| Iannitti Tammy J | $570,000 | -- |
Source: Public Records
Mortgage History
| Date | Status | Borrower | Loan Amount |
|---|---|---|---|
| Previous Owner | Iannitti Tammy J | $456,000 | |
| Previous Owner | Iannitti Tammy J | $311,000 |
Source: Public Records
Tax History
| Year | Tax Paid | Tax Assessment Tax Assessment Total Assessment is a certain percentage of the fair market value that is determined by local assessors to be the total taxable value of land and additions on the property. | Land | Improvement |
|---|---|---|---|---|
| 2025 | $10,785 | $879,000 | $223,400 | $655,600 |
| 2024 | $10,504 | $879,000 | $223,400 | $655,600 |
| 2023 | $10,214 | $879,000 | $223,400 | $655,600 |
| 2022 | $9,718 | $648,300 | $160,900 | $487,400 |
| 2021 | $9,556 | $648,300 | $160,900 | $487,400 |
| 2020 | $8,748 | $610,900 | $160,900 | $450,000 |
| 2019 | $9,179 | $578,000 | $148,100 | $429,900 |
| 2018 | $1,120 | $578,000 | $148,100 | $429,900 |
| 2017 | $8,791 | $578,000 | $148,100 | $429,900 |
| 2016 | $9,619 | $563,200 | $140,400 | $422,800 |
| 2015 | $9,619 | $563,200 | $140,400 | $422,800 |
| 2014 | $9,619 | $563,200 | $140,400 | $422,800 |
| 2013 | $9,146 | $579,600 | $143,200 | $436,400 |
Source: Public Records
Map
Nearby Homes
- 29 Prospect St Unit 2
- 27 Prospect St
- 31 Prospect St Unit 1
- 25 Prospect St
- 63 Carpenter St
- 29 Jenks Ave
- 1270 Broad St
- 416 Brown St
- 519 Mendon Rd Unit 519
- 517 Mendon Rd Unit 517
- 513 Mendon Rd Unit 513
- 515 Mendon Rd Unit 515
- 511 Mendon Rd Unit 511
- 509 Mendon Rd Unit 509
- 150 Cottage St
- 6 Castle Rd
- 500 Mendon Rd Unit 257
- 127 Chestnut St
- 23 Hewes St
- 91 Greenwich St
Your Personal Tour Guide
Ask me questions while you tour the home.