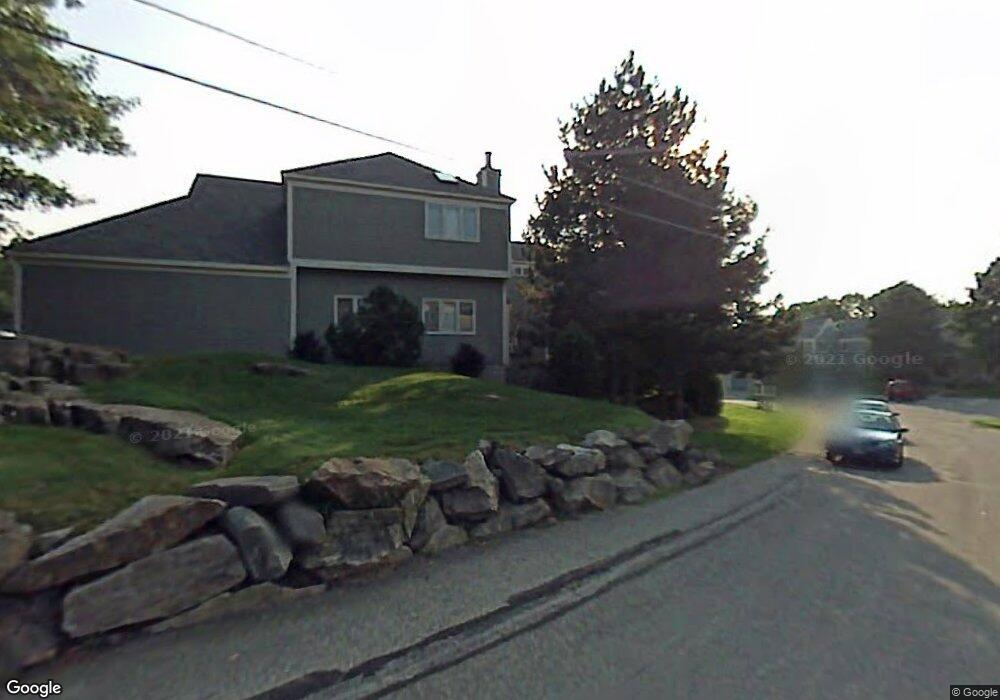
23 Aster Ct Unit U167 Nashua, NH 03062
West Hollis NeighborhoodEstimated Value: $401,049 - $453,000
2
Beds
2
Baths
1,900
Sq Ft
$220/Sq Ft
Est. Value
About This Home
This home is located at 23 Aster Ct Unit U167, Nashua, NH 03062 and is currently estimated at $417,762, approximately $219 per square foot. 23 Aster Ct Unit U167 is a home located in Hillsborough County with nearby schools including Ledge Street Elementary School, Elm Street Middle School, and Nashua High School South.
Ownership History
Date
Name
Owned For
Owner Type
Purchase Details
Closed on
Jun 13, 2020
Sold by
Barnes Sarah M and Mcgarvey Spouse P
Bought by
Sarah M Barnes Lt and Barnes
Current Estimated Value
Home Financials for this Owner
Home Financials are based on the most recent Mortgage that was taken out on this home.
Original Mortgage
$157,389
Interest Rate
3.2%
Mortgage Type
New Conventional
Purchase Details
Closed on
Jan 8, 2016
Sold by
Barnes Sarah M
Bought by
Sarah M Barnes Lt and Barnes
Purchase Details
Closed on
Jan 19, 1998
Sold by
Prostkoff Melvin E
Bought by
Barnes Sarah M
Home Financials for this Owner
Home Financials are based on the most recent Mortgage that was taken out on this home.
Original Mortgage
$35,000
Interest Rate
7.08%
Mortgage Type
Purchase Money Mortgage
Create a Home Valuation Report for This Property
The Home Valuation Report is an in-depth analysis detailing your home's value as well as a comparison with similar homes in the area
Home Values in the Area
Average Home Value in this Area
Purchase History
| Date | Buyer | Sale Price | Title Company |
|---|---|---|---|
| Sarah M Barnes Lt | -- | None Available | |
| Barnes Sarah M | -- | None Available | |
| Sarah M Barnes Lt | -- | None Available | |
| Barnes Sarah M | -- | None Available | |
| Sarah M Barnes Lt | -- | None Available | |
| Barnes Sarah M | -- | None Available | |
| Barnes Sarah M | -- | None Available | |
| Barnes Sarah M | -- | None Available | |
| Sarah M Barnes Lt | -- | -- | |
| Sarah M Barnes Lt | -- | -- | |
| Barnes Sarah M | $115,000 | -- | |
| Barnes Sarah M | $115,000 | -- |
Source: Public Records
Mortgage History
| Date | Status | Borrower | Loan Amount |
|---|---|---|---|
| Previous Owner | Barnes Sarah M | $157,389 | |
| Previous Owner | Barnes Sarah M | $35,000 |
Source: Public Records
Tax History
| Year | Tax Paid | Tax Assessment Tax Assessment Total Assessment is a certain percentage of the fair market value that is determined by local assessors to be the total taxable value of land and additions on the property. | Land | Improvement |
|---|---|---|---|---|
| 2025 | $6,931 | $411,800 | $0 | $411,800 |
| 2024 | $6,548 | $411,800 | $0 | $411,800 |
| 2023 | $6,665 | $365,600 | $0 | $365,600 |
| 2022 | $6,606 | $365,600 | $0 | $365,600 |
| 2021 | $5,654 | $243,500 | $0 | $243,500 |
| 2020 | $5,506 | $243,500 | $0 | $243,500 |
| 2019 | $5,299 | $243,500 | $0 | $243,500 |
| 2018 | $5,165 | $243,500 | $0 | $243,500 |
| 2017 | $4,642 | $180,000 | $0 | $180,000 |
| 2016 | $4,513 | $180,000 | $0 | $180,000 |
| 2015 | $4,415 | $180,000 | $0 | $180,000 |
| 2014 | $4,329 | $180,000 | $0 | $180,000 |
Source: Public Records
Map
Nearby Homes
- 23 Spring Cove Rd Unit U152
- 30 Spring Cove Rd Unit U112
- 47 Dogwood Dr Unit U202
- 45 Dogwood Dr Unit U208
- 668 W Hollis St
- 9 Leslie Ln
- 5 Lowther Place Unit U6
- 36 Silverton Dr Unit U85
- 21 Parkhurst Dr
- 8 Althea Ln Unit U26
- 14 Millbrook Dr
- 4 Burlington Rd
- 40 Hollow Ridge Dr
- 4 Kittery Dr
- 247 Main Dunstable Rd
- 17 Twilight Dr
- 103 Saranac Dr
- 4 Lee Ann St
- 2 Henry David Dr Unit 207
- 16 Champagne Dr Unit U31
- 21 Aster Ct Unit U166
- 25 Aster Ct Unit U168
- 27 Aster Ct Unit U169
- 19 Aster Ct Unit U165
- 29 Aster Ct Unit U170
- 31 Aster Ct Unit U171
- 33 Aster Ct Unit U172
- 17 Aster Ct Unit U164
- 35 Aster Ct Unit U173
- 37 Aster Ct Unit U174
- 7 Foxglove Ct Unit U139
- 5 Foxglove Ct Unit U138
- 7 Iris Ct Unit U148
- 9 Iris Ct Unit U149
- 15 Aster Ct Unit U163
- 11 Iris Ct Unit U150
- 11 Iris Ct Unit 11
- 11 Iris Ct Unit 44
- 39 Aster Ct Unit U175
- 9 Foxglove Ct Unit U140
Your Personal Tour Guide
Ask me questions while you tour the home.