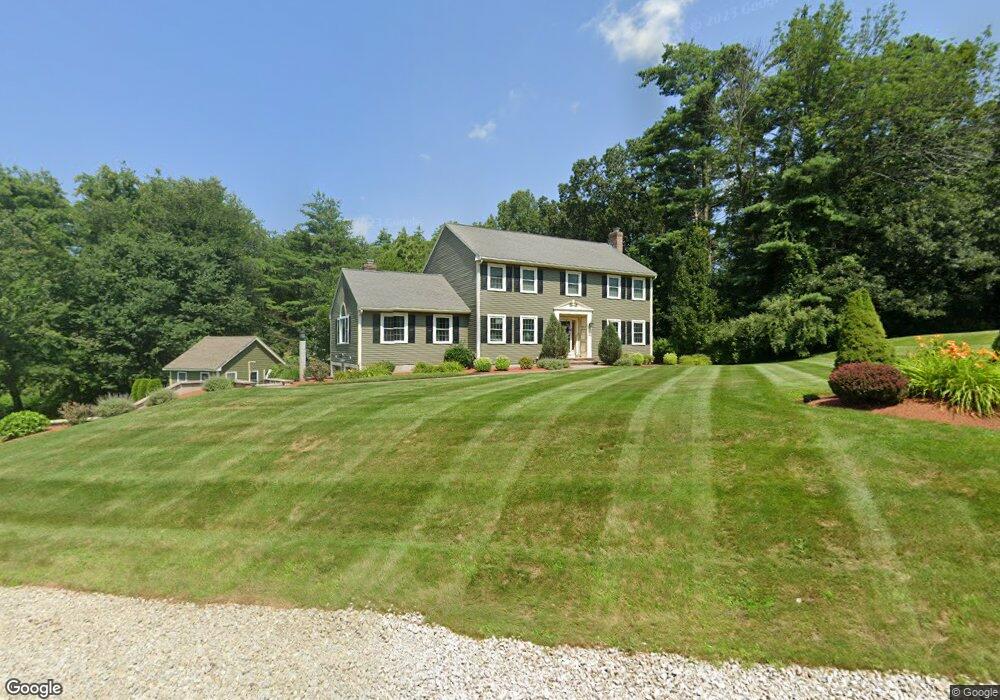
23 Bedros St Windham, NH 03087
Estimated Value: $860,059 - $1,068,000
4
Beds
3
Baths
3,151
Sq Ft
$306/Sq Ft
Est. Value
About This Home
This home is located at 23 Bedros St, Windham, NH 03087 and is currently estimated at $965,265, approximately $306 per square foot. 23 Bedros St is a home located in Rockingham County with nearby schools including Golden Brook Elementary School, Windham Middle School, and Windham High School.
Ownership History
Date
Name
Owned For
Owner Type
Purchase Details
Closed on
Oct 23, 2007
Sold by
Peters John and Peters Andrea
Bought by
Ryan Michael E
Current Estimated Value
Home Financials for this Owner
Home Financials are based on the most recent Mortgage that was taken out on this home.
Original Mortgage
$151,500
Interest Rate
6.51%
Mortgage Type
Purchase Money Mortgage
Purchase Details
Closed on
Jan 28, 2005
Sold by
Farrell Kevin P and Farrell Michelle L
Bought by
Peters John J and Peters Andera K
Home Financials for this Owner
Home Financials are based on the most recent Mortgage that was taken out on this home.
Original Mortgage
$350,000
Interest Rate
5.67%
Mortgage Type
Purchase Money Mortgage
Purchase Details
Closed on
Nov 17, 1997
Sold by
Mordach John P and Mordach Carole E
Bought by
Farrell Kevin P and Farrell Michelle L
Create a Home Valuation Report for This Property
The Home Valuation Report is an in-depth analysis detailing your home's value as well as a comparison with similar homes in the area
Home Values in the Area
Average Home Value in this Area
Purchase History
| Date | Buyer | Sale Price | Title Company |
|---|---|---|---|
| Ryan Michael E | $433,900 | -- | |
| Peters John J | $457,000 | -- | |
| Farrell Kevin P | $265,000 | -- |
Source: Public Records
Mortgage History
| Date | Status | Borrower | Loan Amount |
|---|---|---|---|
| Open | Farrell Kevin P | $155,000 | |
| Closed | Farrell Kevin P | $151,500 | |
| Previous Owner | Farrell Kevin P | $15,400 | |
| Previous Owner | Farrell Kevin P | $350,000 |
Source: Public Records
Tax History
| Year | Tax Paid | Tax Assessment Tax Assessment Total Assessment is a certain percentage of the fair market value that is determined by local assessors to be the total taxable value of land and additions on the property. | Land | Improvement |
|---|---|---|---|---|
| 2024 | $12,590 | $556,100 | $202,300 | $353,800 |
| 2023 | $11,901 | $556,100 | $202,300 | $353,800 |
| 2022 | $10,989 | $556,100 | $202,300 | $353,800 |
| 2021 | $10,355 | $556,100 | $202,300 | $353,800 |
| 2020 | $10,638 | $556,100 | $202,300 | $353,800 |
| 2019 | $10,456 | $463,700 | $185,700 | $278,000 |
| 2018 | $8,991 | $463,700 | $185,700 | $278,000 |
| 2017 | $9,367 | $463,700 | $185,700 | $278,000 |
| 2016 | $9,928 | $455,000 | $185,700 | $269,300 |
| 2015 | $10,039 | $462,200 | $185,700 | $276,500 |
| 2014 | $10,222 | $425,900 | $196,000 | $229,900 |
| 2013 | $9,473 | $401,400 | $196,000 | $205,400 |
Source: Public Records
Map
Nearby Homes
- 106 N Lowell Rd
- 14 Londonderry Rd
- 2 Mulberry St
- 39 Overton Rd
- 7 Lilac Ridge Rd
- 16 Towne Dr
- 4 Arbor Rd
- 16 Arbor Rd
- 98 Trails Edge Rd
- 5 Hidden Valley Rd
- 54 Enterprise Dr
- 67 Forest St
- 13 Kilrea Rd Unit L
- 242 Rockingham Rd
- 24 Rockingham Rd
- 6 Chadwick Cir
- 5 Craven Terrace
- 3 Evergreen Way Unit End unit
- 41 Derryfield Rd
- 4 Westview Dr
Your Personal Tour Guide
Ask me questions while you tour the home.