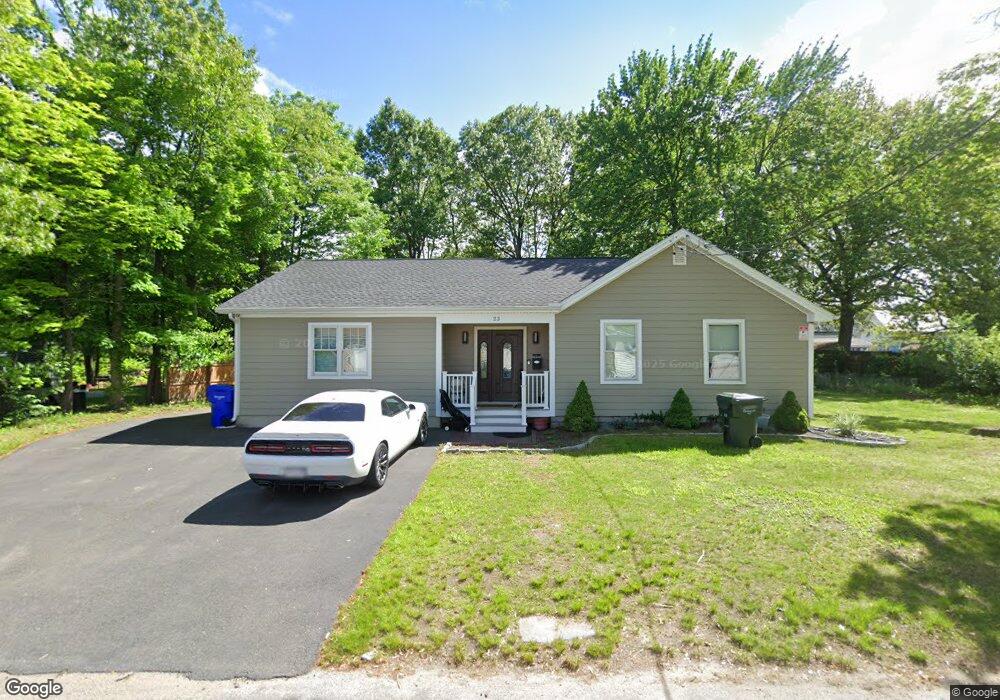
23 Benham St Springfield, MA 01109
Pine Point NeighborhoodEstimated Value: $320,987 - $356,000
3
Beds
2
Baths
1,588
Sq Ft
$212/Sq Ft
Est. Value
About This Home
This home is located at 23 Benham St, Springfield, MA 01109 and is currently estimated at $335,997, approximately $211 per square foot. 23 Benham St is a home located in Hampden County with nearby schools including Hiram L. Dorman Elementary, John F. Kennedy Academy, and Springfield Central High School.
Ownership History
Date
Name
Owned For
Owner Type
Purchase Details
Closed on
Feb 17, 2000
Sold by
Department Of Housing & Urban Dev
Bought by
Tanski Steven M
Current Estimated Value
Home Financials for this Owner
Home Financials are based on the most recent Mortgage that was taken out on this home.
Original Mortgage
$36,400
Outstanding Balance
$11,989
Interest Rate
8.11%
Mortgage Type
Purchase Money Mortgage
Estimated Equity
$324,008
Purchase Details
Closed on
Oct 5, 1999
Sold by
Brailey Archie
Bought by
Norwest Mtg Inc
Purchase Details
Closed on
Dec 8, 1995
Sold by
Jasper Inc
Bought by
Brailey Archie
Home Financials for this Owner
Home Financials are based on the most recent Mortgage that was taken out on this home.
Original Mortgage
$49,200
Interest Rate
7.44%
Mortgage Type
Purchase Money Mortgage
Purchase Details
Closed on
Sep 22, 1995
Sold by
Bisson Jeffrey D
Bought by
Kittredge Charles
Create a Home Valuation Report for This Property
The Home Valuation Report is an in-depth analysis detailing your home's value as well as a comparison with similar homes in the area
Home Values in the Area
Average Home Value in this Area
Purchase History
| Date | Buyer | Sale Price | Title Company |
|---|---|---|---|
| Tanski Steven M | $45,501 | -- | |
| Norwest Mtg Inc | $57,385 | -- | |
| Brailey Archie | $49,000 | -- | |
| Kittredge Charles | $30,000 | -- |
Source: Public Records
Mortgage History
| Date | Status | Borrower | Loan Amount |
|---|---|---|---|
| Open | Kittredge Charles | $36,400 | |
| Previous Owner | Kittredge Charles | $49,200 | |
| Previous Owner | Kittredge Charles | $15,000 |
Source: Public Records
Tax History
| Year | Tax Paid | Tax Assessment Tax Assessment Total Assessment is a certain percentage of the fair market value that is determined by local assessors to be the total taxable value of land and additions on the property. | Land | Improvement |
|---|---|---|---|---|
| 2025 | $4,561 | $290,900 | $44,500 | $246,400 |
| 2024 | $4,585 | $285,500 | $37,100 | $248,400 |
| 2023 | $3,797 | $222,700 | $33,700 | $189,000 |
| 2022 | $3,805 | $202,200 | $31,500 | $170,700 |
| 2021 | $3,262 | $172,600 | $28,700 | $143,900 |
| 2020 | $3,101 | $158,800 | $28,700 | $130,100 |
| 2019 | $2,956 | $150,200 | $28,700 | $121,500 |
| 2018 | $2,832 | $143,900 | $28,700 | $115,200 |
| 2017 | $2,739 | $139,300 | $26,500 | $112,800 |
| 2016 | $1,229 | $62,500 | $26,500 | $36,000 |
| 2015 | -- | $90,300 | $26,500 | $63,800 |
Source: Public Records
Map
Nearby Homes
Your Personal Tour Guide
Ask me questions while you tour the home.