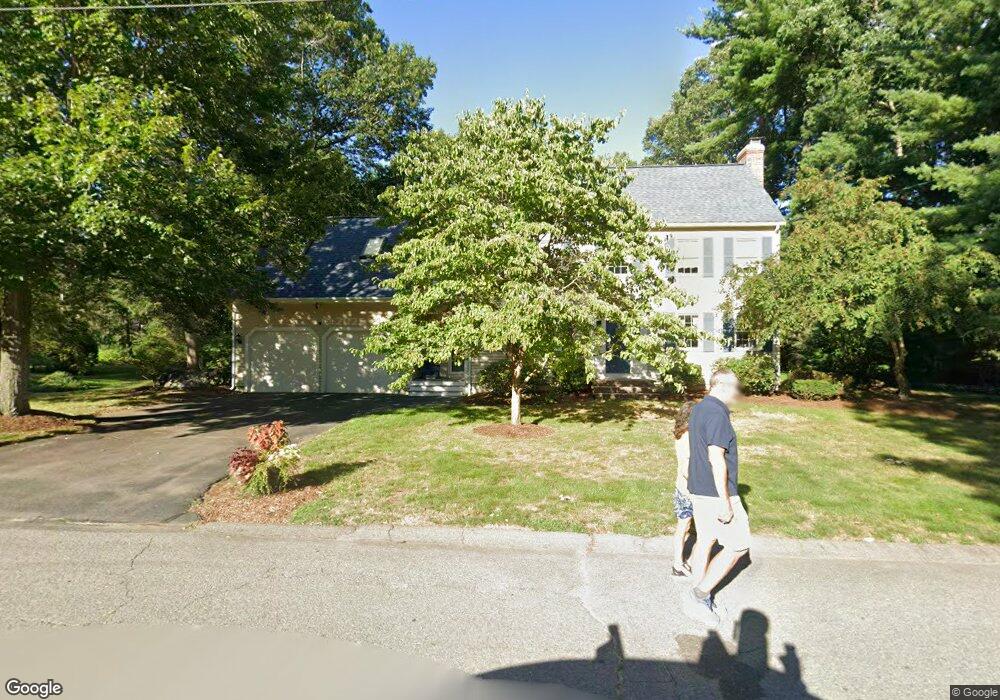
23 Berndt Dr Attleboro, MA 02703
Estimated Value: $661,000 - $842,000
3
Beds
3
Baths
2,519
Sq Ft
$281/Sq Ft
Est. Value
About This Home
This home is located at 23 Berndt Dr, Attleboro, MA 02703 and is currently estimated at $707,169, approximately $280 per square foot. 23 Berndt Dr is a home located in Bristol County with nearby schools including A. Irvin Studley Elementary School, Cyril K. Brennan Middle School, and Attleboro High School.
Ownership History
Date
Name
Owned For
Owner Type
Purchase Details
Closed on
Dec 11, 1998
Sold by
Brooks John J and Brooks Patricia E
Bought by
Gay Robert J and Gay Linda A
Current Estimated Value
Home Financials for this Owner
Home Financials are based on the most recent Mortgage that was taken out on this home.
Original Mortgage
$183,900
Interest Rate
6.8%
Mortgage Type
Purchase Money Mortgage
Purchase Details
Closed on
Aug 25, 1989
Sold by
East Coast Dev Ltd
Bought by
Brooks John J
Create a Home Valuation Report for This Property
The Home Valuation Report is an in-depth analysis detailing your home's value as well as a comparison with similar homes in the area
Home Values in the Area
Average Home Value in this Area
Purchase History
| Date | Buyer | Sale Price | Title Company |
|---|---|---|---|
| Gay Robert J | $229,900 | -- | |
| Brooks John J | $183,900 | -- |
Source: Public Records
Mortgage History
| Date | Status | Borrower | Loan Amount |
|---|---|---|---|
| Open | Brooks John J | $261,000 | |
| Closed | Brooks John J | $183,900 | |
| Previous Owner | Brooks John J | $31,000 | |
| Previous Owner | Brooks John J | $139,500 |
Source: Public Records
Tax History
| Year | Tax Paid | Tax Assessment Tax Assessment Total Assessment is a certain percentage of the fair market value that is determined by local assessors to be the total taxable value of land and additions on the property. | Land | Improvement |
|---|---|---|---|---|
| 2025 | $6,403 | $510,200 | $167,400 | $342,800 |
| 2024 | $6,044 | $474,800 | $150,700 | $324,100 |
| 2023 | $5,710 | $417,100 | $152,300 | $264,800 |
| 2022 | $5,478 | $379,100 | $145,000 | $234,100 |
| 2021 | $5,338 | $360,700 | $139,500 | $221,200 |
| 2020 | $5,087 | $349,400 | $133,300 | $216,100 |
| 2019 | $4,498 | $350,000 | $130,900 | $219,100 |
| 2018 | $4,104 | $324,200 | $127,000 | $197,200 |
| 2017 | $3,882 | $321,500 | $123,800 | $197,700 |
| 2016 | $4,523 | $305,200 | $115,500 | $189,700 |
| 2015 | $4,400 | $299,100 | $115,500 | $183,600 |
| 2014 | $4,339 | $292,200 | $110,600 | $181,600 |
Source: Public Records
Map
Nearby Homes
- 160 West St
- 101 South Ave Unit 1004
- 101 South Ave Unit 501
- 660 Thacher St Unit 402
- 720 Thacher St
- 23 Greenhill Ave
- 17 Jewel Ave
- 46 Berwick Rd
- 75 Dennis St Unit 3
- 49 Dennis St
- 64 Mechanic St Unit 3
- 64 Mechanic St
- 21 4th St
- 147 County St
- 855 County St Unit 2
- 20 Elizabeth St
- 126 Linden St Unit A
- 10 John St
- 15 North Ave
- 1 Bellmore St
Your Personal Tour Guide
Ask me questions while you tour the home.