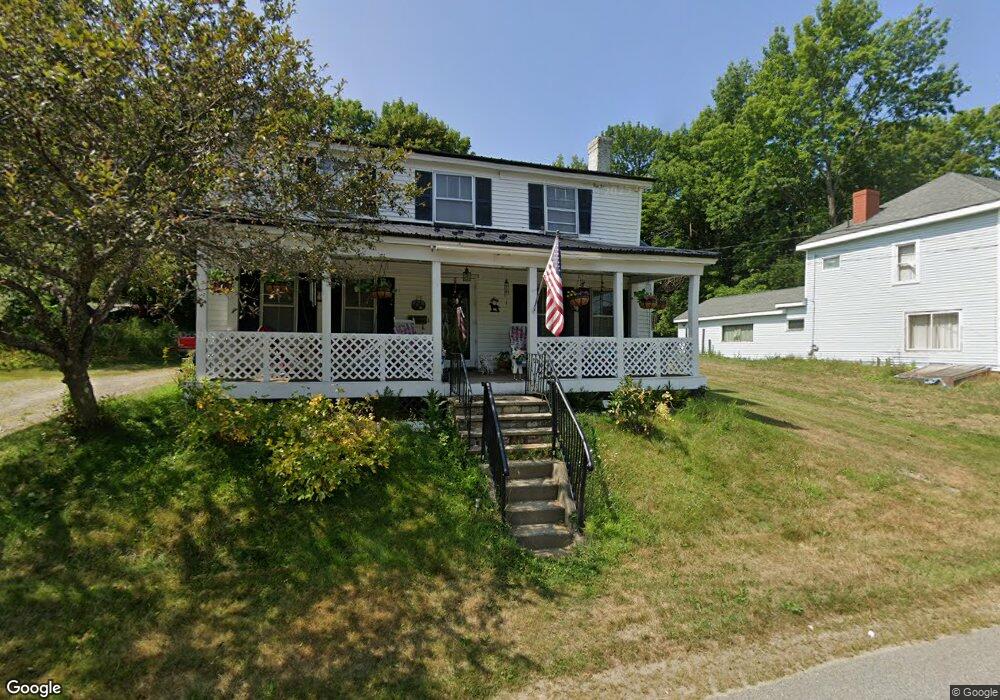
23 Boardman St Calais, ME 04619
Estimated Value: $132,000 - $147,000
4
Beds
2
Baths
825
Sq Ft
$173/Sq Ft
Est. Value
About This Home
This home is located at 23 Boardman St, Calais, ME 04619 and is currently estimated at $142,329, approximately $172 per square foot. 23 Boardman St is a home with nearby schools including Calais Elementary School and Calais Middle/High School.
Ownership History
Date
Name
Owned For
Owner Type
Purchase Details
Closed on
Apr 14, 2010
Sold by
Us Bank Na Tr
Bought by
Kneizys Steven
Current Estimated Value
Purchase Details
Closed on
May 2, 2007
Sold by
Mcphee Charles D
Bought by
Bagley Karen
Home Financials for this Owner
Home Financials are based on the most recent Mortgage that was taken out on this home.
Original Mortgage
$56,000
Interest Rate
12%
Mortgage Type
Adjustable Rate Mortgage/ARM
Create a Home Valuation Report for This Property
The Home Valuation Report is an in-depth analysis detailing your home's value as well as a comparison with similar homes in the area
Home Values in the Area
Average Home Value in this Area
Purchase History
| Date | Buyer | Sale Price | Title Company |
|---|---|---|---|
| Kneizys Steven | -- | -- | |
| Bagley Karen | -- | -- |
Source: Public Records
Mortgage History
| Date | Status | Borrower | Loan Amount |
|---|---|---|---|
| Previous Owner | Bagley Karen | $56,000 |
Source: Public Records
Tax History
| Year | Tax Paid | Tax Assessment Tax Assessment Total Assessment is a certain percentage of the fair market value that is determined by local assessors to be the total taxable value of land and additions on the property. | Land | Improvement |
|---|---|---|---|---|
| 2024 | $1,400 | $93,300 | $14,400 | $78,900 |
| 2023 | $1,369 | $80,500 | $12,400 | $68,100 |
| 2022 | $1,235 | $65,000 | $10,000 | $55,000 |
| 2021 | $1,346 | $62,300 | $9,600 | $52,700 |
| 2020 | $1,348 | $53,300 | $8,200 | $45,100 |
| 2019 | $1,348 | $53,300 | $8,200 | $45,100 |
| 2018 | $1,348 | $53,300 | $8,200 | $45,100 |
| 2017 | $1,348 | $53,300 | $8,200 | $45,100 |
| 2016 | $1,348 | $53,300 | $8,200 | $45,100 |
| 2015 | $1,348 | $53,300 | $8,200 | $45,100 |
| 2014 | $1,348 | $53,300 | $8,200 | $45,100 |
| 2013 | $1,348 | $53,300 | $8,200 | $45,100 |
Source: Public Records
Map
Nearby Homes
- 44 Boardman St
- 19 Fowler St
- 503 South St
- 43 Harrison St
- 445 South St
- P/O Lot 6 Higgins Farm Rd
- Lot 5 Higgins Farm Rd
- Lot 4 Higgins Farm Rd
- TBD Baring St
- 506 Baring St
- 102 Garfield St
- 26 Garfield St
- 33 Pleasant St
- 24 Willow St
- M5B7L8 Pleasant St
- 24 Todd St
- 92 Lafayette St
- 91 Downes St
- 37 Price St
- 96 Barker St
Your Personal Tour Guide
Ask me questions while you tour the home.