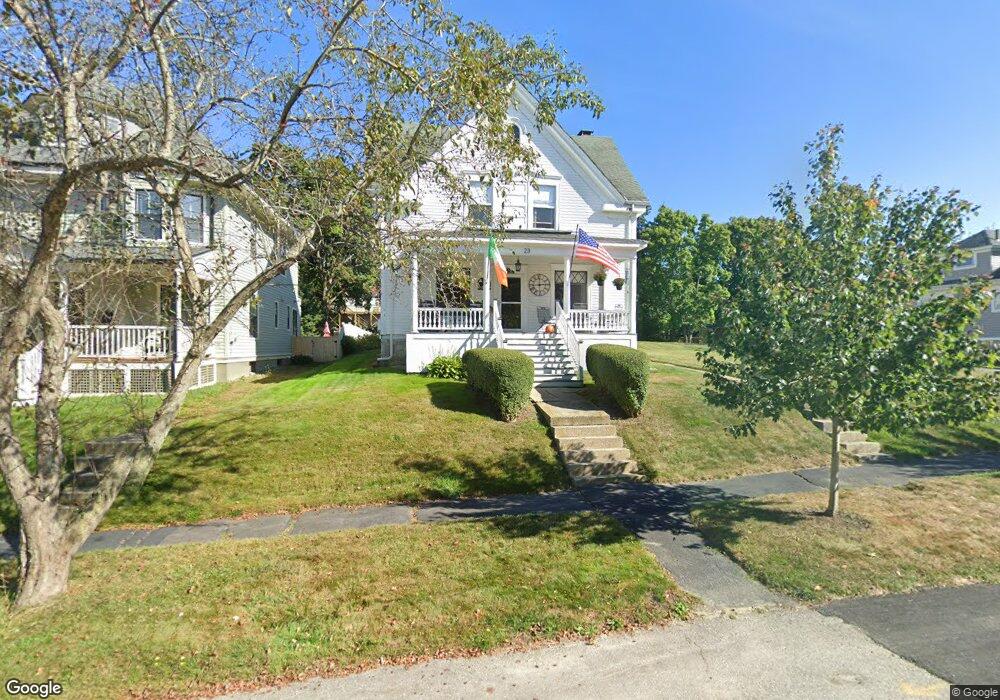
23 Bradley St Portland, ME 04102
Rosemont NeighborhoodEstimated Value: $604,000 - $727,000
4
Beds
2
Baths
1,791
Sq Ft
$365/Sq Ft
Est. Value
About This Home
This home is located at 23 Bradley St, Portland, ME 04102 and is currently estimated at $652,848, approximately $364 per square foot. 23 Bradley St is a home located in Cumberland County with nearby schools including Ocean Avenue Elementary School, King Middle School, and Levey Day School.
Ownership History
Date
Name
Owned For
Owner Type
Purchase Details
Closed on
Mar 20, 2025
Sold by
Brooks Edge Farm Llc
Bought by
Flaherty Edward P
Current Estimated Value
Home Financials for this Owner
Home Financials are based on the most recent Mortgage that was taken out on this home.
Original Mortgage
$476,000
Outstanding Balance
$472,720
Interest Rate
6.85%
Mortgage Type
New Conventional
Estimated Equity
$180,128
Purchase Details
Closed on
Aug 1, 2008
Sold by
Dimillo Jane L
Bought by
Flaherty Edward P
Home Financials for this Owner
Home Financials are based on the most recent Mortgage that was taken out on this home.
Original Mortgage
$275,000
Interest Rate
6.47%
Mortgage Type
Unknown
Purchase Details
Closed on
Jan 30, 2008
Sold by
Flaherty Matthew J
Bought by
Flaherty Jane D
Create a Home Valuation Report for This Property
The Home Valuation Report is an in-depth analysis detailing your home's value as well as a comparison with similar homes in the area
Home Values in the Area
Average Home Value in this Area
Purchase History
| Date | Buyer | Sale Price | Title Company |
|---|---|---|---|
| Flaherty Edward P | $600,598 | None Available | |
| Flaherty Edward P | $600,598 | None Available | |
| Flaherty Edward P | -- | -- | |
| Flaherty Edward P | -- | -- | |
| Flaherty Jane D | -- | -- | |
| Flaherty Jane D | -- | -- |
Source: Public Records
Mortgage History
| Date | Status | Borrower | Loan Amount |
|---|---|---|---|
| Open | Flaherty Edward P | $476,000 | |
| Closed | Flaherty Edward P | $476,000 | |
| Previous Owner | Flaherty Jane D | $275,000 |
Source: Public Records
Tax History Compared to Growth
Tax History
| Year | Tax Paid | Tax Assessment Tax Assessment Total Assessment is a certain percentage of the fair market value that is determined by local assessors to be the total taxable value of land and additions on the property. | Land | Improvement |
|---|---|---|---|---|
| 2024 | $6,345 | $422,700 | $101,100 | $321,600 |
| 2023 | $6,091 | $422,700 | $101,100 | $321,600 |
| 2022 | $5,753 | $422,700 | $101,100 | $321,600 |
| 2021 | $5,491 | $422,700 | $101,100 | $321,600 |
| 2020 | $6,259 | $268,500 | $95,600 | $172,900 |
| 2019 | $6,259 | $268,500 | $95,600 | $172,900 |
| 2018 | $6,036 | $268,500 | $95,600 | $172,900 |
| 2017 | $5,813 | $268,500 | $95,600 | $172,900 |
| 2016 | $5,668 | $268,500 | $95,600 | $172,900 |
| 2015 | $5,539 | $268,500 | $95,600 | $172,900 |
| 2014 | $5,370 | $268,500 | $95,600 | $172,900 |
Source: Public Records
Map
Nearby Homes
- 24 Edwards St
- 7 Twin Knolls Ln
- 162 Hobart St
- 160 Craigie St
- 4 Fairview St
- 18 Stoneledge Dr
- 1542 Congress St
- 296 Brighton Ave
- 6 Highland St
- 159 Bancroft St
- 200 Massachusetts Ave
- 232 Brighton Ave
- 14 Prospect St
- 55 Payson St Unit 2
- 7 Cherry St
- 61 Deane St
- 48 Ashmont St
- 63A Capisic St
- 37 Tremont St
- 89 Cobb Ave
- 15 Bradley St
- 25 Bradley St
- 14 Bradley St
- 24 Bradley St
- 10 Bradley St
- 39 Bradley St
- 30 Bradley St
- 26 Caleb St
- 22 Caleb St
- 28 Caleb St
- 28 Caleb St Unit 1
- 18 Caleb St
- 38 Bradley St
- 1363 Congress St Unit 3
- 1363 Congress St Unit 2
- 1363 Congress St Unit 1
- 1363 Congress St
- 38 Caleb St
- 11 Stevens Ave
- 21 Stevens Ave